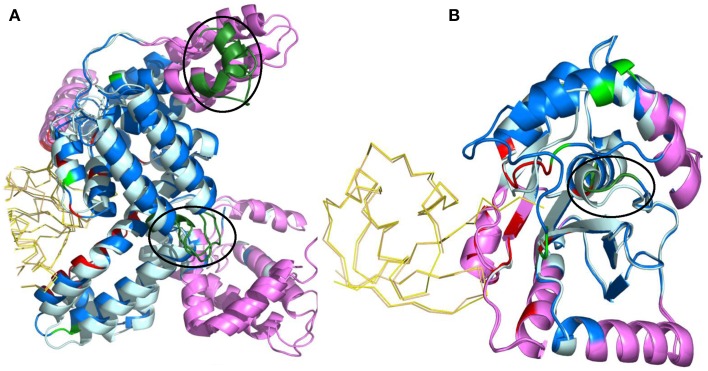
Figure 7.
Normal mode analysis of structural changes in regions of low B-factor far from interface. The protein containing the region of interest is depicted as cartoon and the interface of the other protein in ribbon. Unbound and bound forms of the protein of interest are in pale cyan and marine blue, respectively. The partner protein's unbound and bound forms are in light orange and yellow, respectively. Interacting residues are in red and non-interacting residues with PB change in green. All regions of interest are marked with a black circle, irrespective of whether they are intrinsically mobile or rigid. Regions identified to be intrinsically mobile according to NMA are in violet. Regions of interest occurring within the intrinsically mobile segments are in dark green. The complexes shown are (A) α-actin and Vitamin D - binding protein (PDB code 1KXP, Otterbein et al., 2002) (B) Ubiquitin Carboxyl-terminal esterase L3 protein and Ubiquitin complex (PDB code 1XD3, Misaghi et al., 2005). These figures show that non-interacting regions observed to undergo conformational changes upon complexation are usually intrinsically mobile, which is a characteristic of a functional site. Visualization was created by the program PyMOL (http://www.pymol.org, Delano, 2013).

