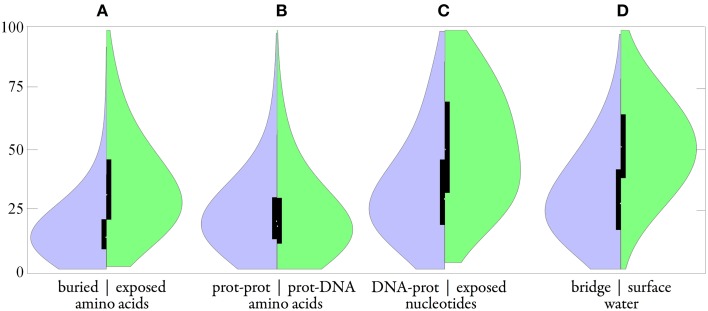
Figure 9.
Distributions of B-factors in the group of protein-DNA complexes (165 structures with crystallographic resolution 1.9 Å and better). Smooth plot (A) compared buried amino acid (left in purple) vs. exposed aa (right in green); (B) protein-protein aa vs. protein-DNA aa; (C) DNA-protein nucleotide vs. exposed nt; (D) bridge water vs. surface w. Black boxes show the second and third quartiles; the white spot indicates the median.

