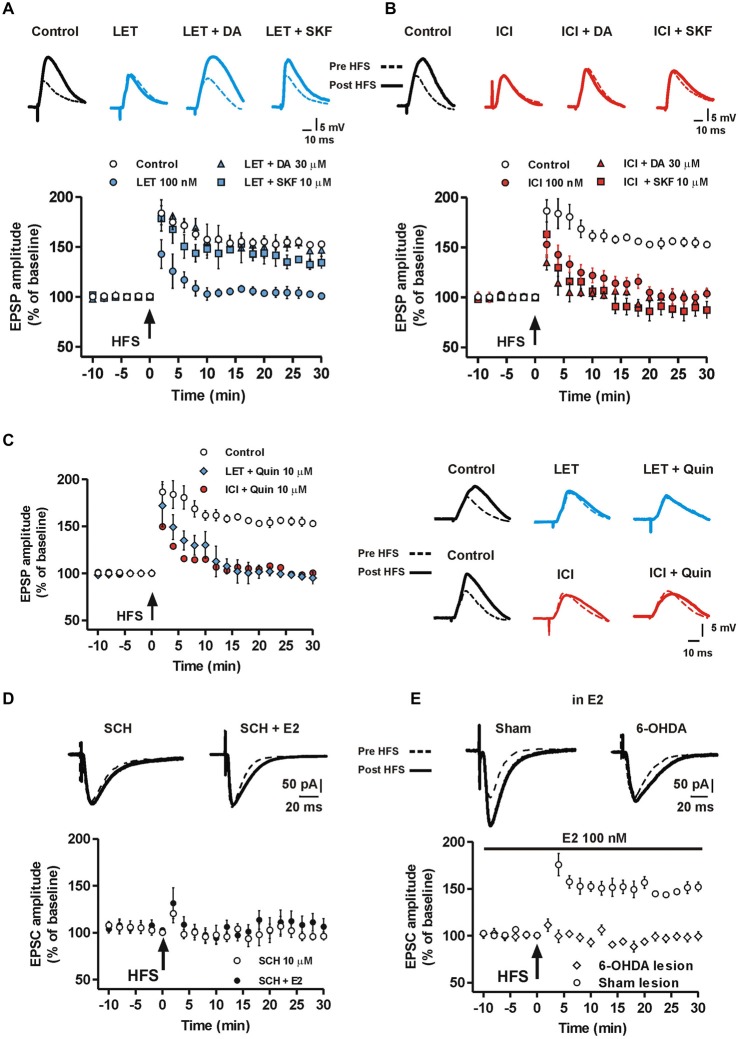
Figure 4.
Effect of DA and DA-R stimulation on MSN LTP in the presence of aromatase inhibition and ER antagonism. (A) MSNs EPSP pairs of traces acquired before and after HFS and time-courses of the HFS effect on EPSP amplitude recorded in control conditions, in the presence of LET, LET plus 30 μM DA and LET plus 10 μM SKF. (B) EPSP traces and time-courses acquired in control conditions, in the presence of ICI, ICI plus 30 μM DA and ICI plus 10 μM SKF. (C) Time courses on the left show the effect of HFS on EPSP amplitude in control conditions, in the presence of LET plus 10 μM quinpirole and in the presence of ICI plus 10 μM quinpirole. EPSP traces on the right are recorded from MSNs before and after the HFS, upper traces: in control conditions, in the presence of LET or LET plus 10 μM quinpirole (LET + Quin); lower traces: in control conditions, in the presence of ICI or ICI plus quinpirole (ICI + Quin). Note that quinpirole in not able to restore LTP both in the presence of LET and ICI. (D) Time-course showing the EPSC amplitude of MSNs recorded in the presence of 10 μM of the D1R antagonist SCH or SCH plus 100 nM E2 co-applied before and following the HFS protocol. Upper EPSC traces recorded in MSNs before and 30 min after the HFS protocol in the presence of SCH or SCH plus E2. (E) Time-course graph of the EPSC amplitude measured in MSNs from 6-OHDA DA-denervated rats and sham-operated animals in the presence of 100 nM E2. Upper traces show EPSC acquired from a MSN of a 6-OHDA-lesioned rat and a sham-operated animal before and after the HFS protocol.

