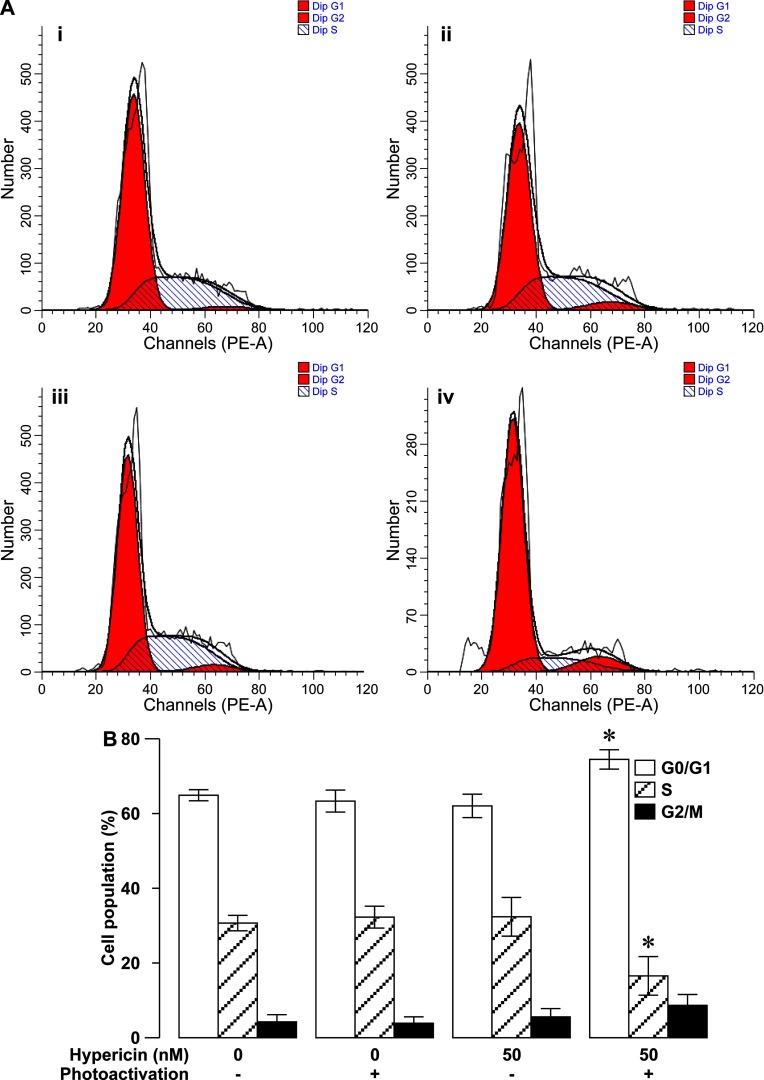
Figure 4. Photoactivated hypericin-induced cell-cycle arrest in the G0/G1-phase in RINm5F insulinoma cells.
(A) Representative cell-cycle profiles observed in solvent control treatment (control) (i), solvent control treatment followed by photoactivation (control/photoactivation) (ii), hypericin loading (hypericin) (iii) and hypericin loading followed by photoactivation (hypericin/photoactivation) (iv) using flow cytometry. (B) Flow cytometric quantification of the percentage of cells subjected to control, control/photoactivation, hypericin and hypericin/photoactivation treatments respectively, in the G0/G1, S and G2/M phases of the cell cycle. The percentage of G0/G1 phase-arrested cells was significantly more in hypericin/photoactivation group (N=3) than in the other three groups (N=3), whereas the percentage of S-phase cells was significantly less in hypericin/photoactivation group (N=3) than in the other three groups (N=3). *P<0.05 compared with control, control/photoactivation and hypericin.

