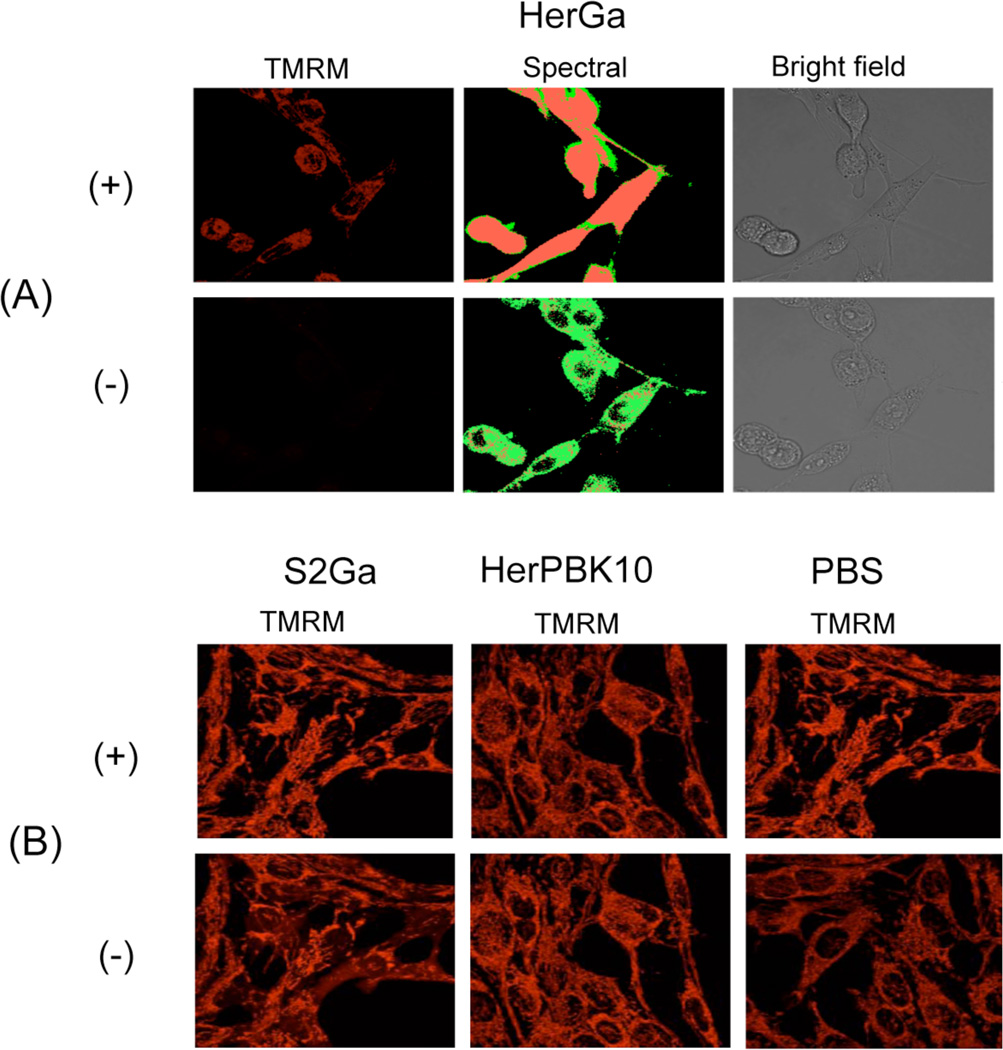
Fig. 2. Mitochondrial membrane potential variation of cells treated with HerGa, HerPBK10, S2GA, or PBS -/+ light exposure.
(A) Confocal images of HerGa treated cell -/+ light (450nm–490nm, 17J/cm2). Left, TMRM fluorescence; Middle, spectral classified images. Red: TMRM. Green: HerGa. Right, bright field images (B) confocal TMRM fluorescence images of S2Ga, HerPBK10, and PBS treated cells -/+ light (450nm–490nm, 17J/cm2).

