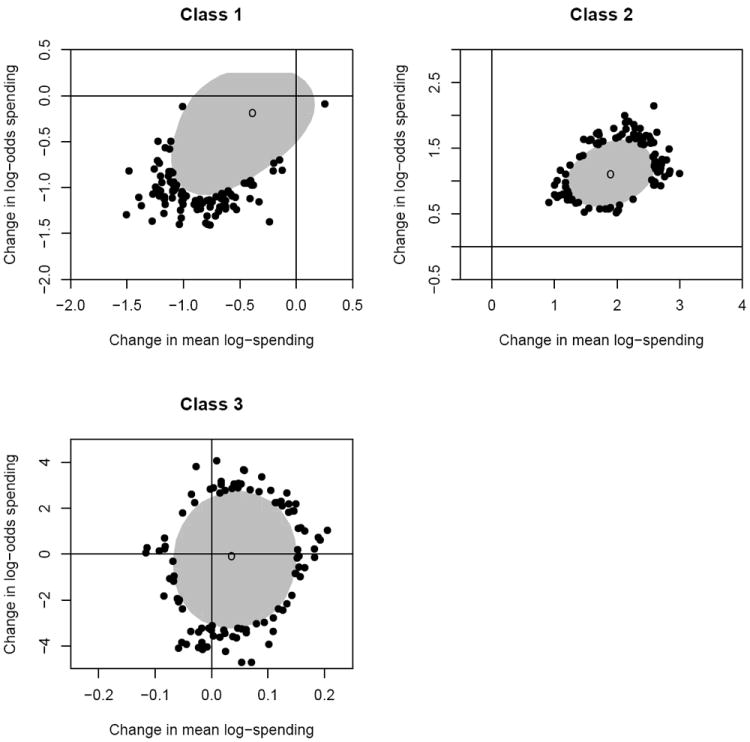
Figure 2.

Posterior 95% highest probability density (HPD) regions for contrasts assessing the effect of the parity law. Y-axes represent the change in log-odds of any spending before and after introduction of parity; x-axes represent the change in the average amount spent (on the log scale) before and after parity. Shaded regions correspond to the bivariate 95% HPD regions, open circles denote posterior modes, and dots denote observations outside the 95% contours. For classes 1 and 3, the 95% HPD regions intersect the origin, suggesting no significant change due to parity. Conversely, class 2 showed a significant increase in both the log odds of any spending and the mean amount spent following parity.
