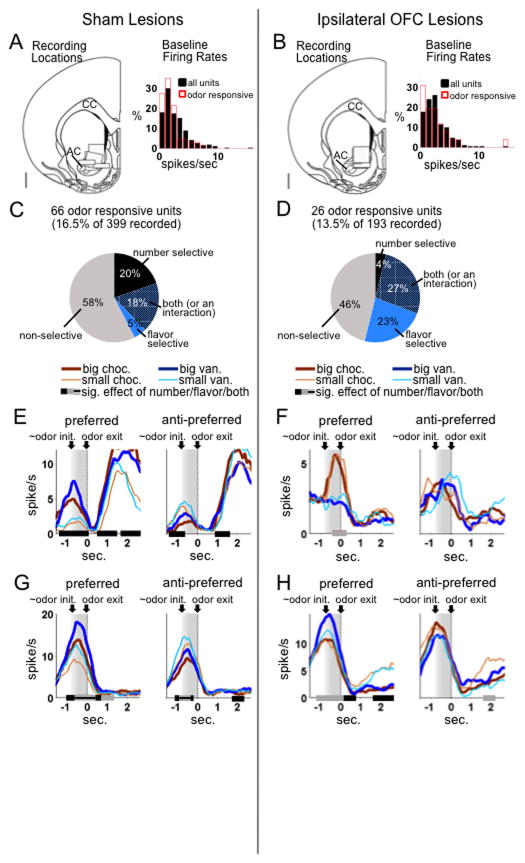
Figure 2. Single-unit recordings of odor-responsive units.
A,B. Shown are recording locations and baseline firing rate distributions in the sham (A) and OFC-lesioned group (B). The width of each box (1 mm) represents the approximate spread of recording wires, and the height the estimated range through which the bundle was driven during recording sessions. Each box represents one rat. The scale bar represents 1 mm. CC = corpus callosum; AC = anterior commissure. Baseline firing rates were not significantly different in the two groups, for either the whole population (t590 = −0.15, p=0.88) or in the odor-responsive population, (t90 = −1.5, p=0.13).
C,D. Pie charts represent all odor-responsive units (defined as those with a significant increase over baseline during the odor epoch). Colored sections represent units with significant effects of number (black), flavor (blue), or both (cross-hatched), based on an ANOVA on firing rate in that unit’s preferred direction during the odor epoch.
There was no significant difference in the proportion of odor-responsive units in the two groups (by chi-square, p=0.25). However, with OFC lesions, units were significantly more likely to be flavor-selective and significantly less likely to be number-selective with no effect of flavor (chi-square on distribution of units across these categories p<0.0001). Indeed, by chi-square, in the sham group, the number of purely flavor-selective neurons (with no effect of number) was not significantly different from chance (p=0.74), while the number of purely number-selective neurons was significantly greater than chance (p<0.00001); in the lesion group, the opposite was true (purely flavor-selective, p<0.00001; purely number-selective, p=0.90).
E–H. Single-unit examples from the sham (E,G) and lesion groups (F,H). Black and gray bars indicate bins with a significant effect of number or flavor, respectively, by ANOVA on a sliding average of five bins. Significant effects were found mostly on the preferred side (left side of each panel). Units in the control group tended to prefer the odors predicting large outcomes, in some cases with no effect of flavor (E) and in other cases with an additional effect of flavor (G). Units in the lesion group were more likely to be flavor-selective without a strong effect of number.

