
Figure 7.
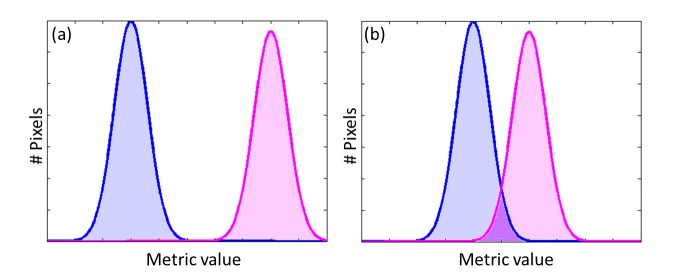
Histograms for metric evaluation. (a) An example of good metric and (b) an example of metric that will have errors in classification when the metric value lies in the overlapping area of the two curves.
Official websites use .gov
A
.gov website belongs to an official
government organization in the United States.
Secure .gov websites use HTTPS
A lock (
) or https:// means you've safely
connected to the .gov website. Share sensitive
information only on official, secure websites.
Histograms for metric evaluation. (a) An example of good metric and (b) an example of metric that will have errors in classification when the metric value lies in the overlapping area of the two curves.