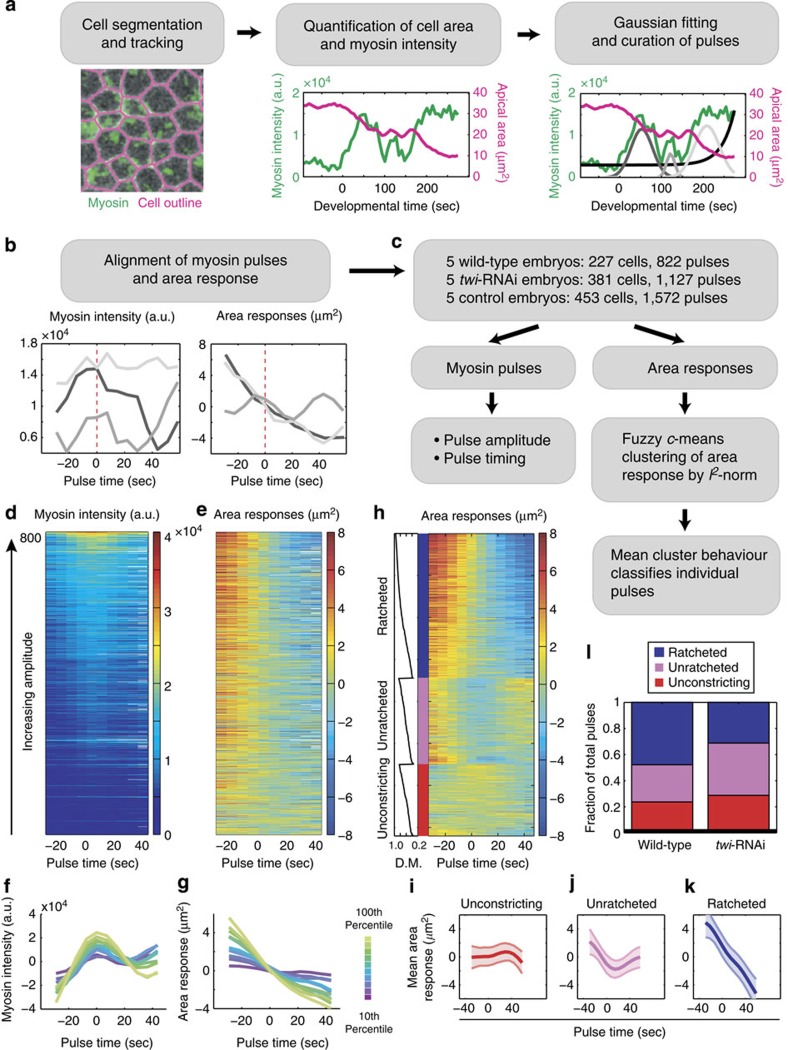
Figure 1. Computational framework for pulse identification, classification and quantification.
(a) Cell outlines were segmented and tracked to measure the cell area (magenta) and apical myosin intensity (green)41. Myosin-intensity peaks (pulses) and background exponential increase (black) were identified by a multiple Gaussian fitting algorithm and subject to manual curation. The final curated Gaussian fits are shown in grey (right). (b) Pulses identified from the example cell in a were aligned by their centres (dotted line) to simultaneously quantify myosin intensity and area response. (c) Pipeline for quantifying myosin properties and area responses of individual pulses. Pulse magnitude and timing were measured by the Gaussian amplitude and mean, respectively. Local area response was clustered into behaviour classes by FCM and classified on the basis of the mean class behaviour. (d,e) Heatmaps of wild-type pulses identified and used in this study. Myosin intensity (d) and area response (e) of all pulses (n=822) identified from wild-type embryos (n=5) and sorted by pulse intensity. (f,g) Magnitude of apical constriction depends on the amplitude of myosin pulses. Average mean-centred myosin intensity (f) and average mean-centred area response (g) of pulses in various amplitude-bins. Colours denote the percentile-ranking in pulse amplitude (n>80 for each colour). (h) Pulses were clustered into three categories according to their area response behaviours. Heatmap shows the area responses to pulses (n=720) clustered by FCM into ratcheted (blue), unratcheted (magenta) and unconstricting classes (red). Within each class, pulses were also sorted by the degree of membership (D.M.) of each area response within their respective category (left). Pulses with missing data points were not categorized and not shown (n=102). (i–k) Average area response within each behaviour class. (i) Unconstricting pulses display no or minimal constriction (n=171). (j) Unratcheted pulses display unstabilized constrictions (n=205). (k) Ratcheted pulses display stabilized constrictions (n=344). Shaded areas represent s.d. (l) Fraction of pulses with given behaviour in wild-type (n=5) and twi-RNAi embryos (n=5).

