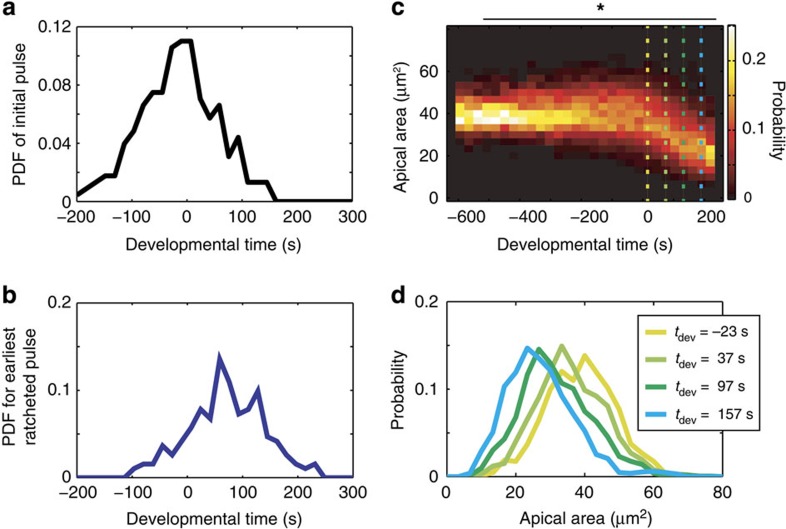
Figure 3. Ventral furrow cells initiate contraction as a single population.
(a) Distribution of timing of the initial pulse is unimodal. The timing of the first pulse from each wild-type cell is quantified and exhibits a single mode in density. The probability density function (PDF) is shown. (b) Distribution of timing of the first ratcheted pulse is unimodal. The timing of the first pulse from each wild-type cell that was ratcheted is quantified. (c) Apical area decreases smoothly as a single population. The probability distributions of apical areas is quantified across temporal bins in developmental time and shows that cells constrict as a single population. Dotted lines refer to plots in d. *P>0.1, Hartigan's dip test for nonunimodality21. (d) The distribution of apical area is shown for four time points during ventral furrow formation. Colours correspond to dotted lines in c.

