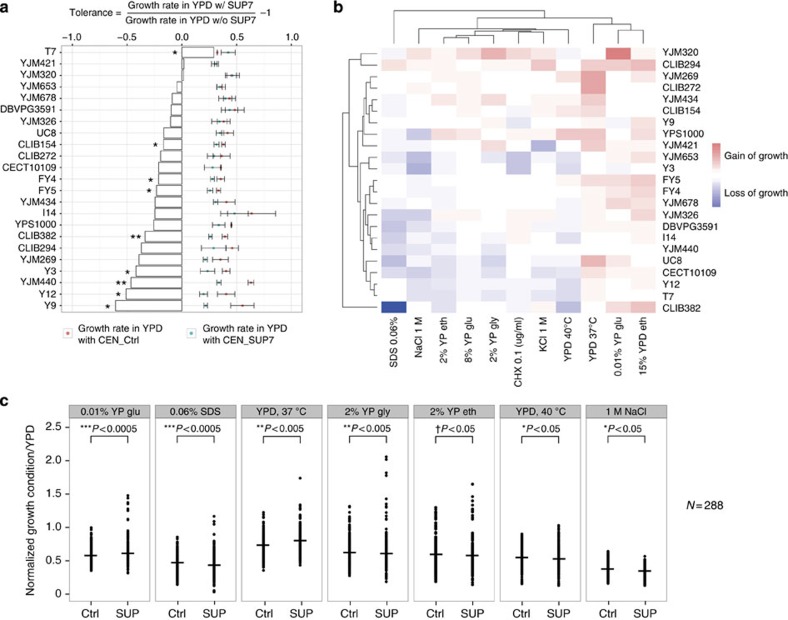
Figure 3. Phenotypic consequences of SUP7 in various isolates.
(a) Growth variation in the presence of SUP7 in non-stressful conditions (YPD, 30 °C). Growth rates of 23 strains measured in liquid YPD at 30 °C in the presence of a plasmid containing SUP7 (blue dots) or empty control vector (red dots) are presented with error bars (mean±s.d.; N=6). Percentage of growth variation is calculated and presented as bars (N=6; two-sided t-test *P value<0.05; **P value<0.005). (b) Suppressor induced phenotypic variation in stress conditions. Significant variation of the normalized growth ratio (>10%) due to the presence of SUP7 of 23 strains is presented for 11 stress conditions using a heatmap with blue indicating loss of growth and red for gain of growth compared with strains carrying the empty control vector. (c) Significant increase of phenotypic variance in the presence of SUP7. Distribution of the normalized growth ratio in stress conditions was compared for strains carrying the suppressor SUP7 (SUP) or control (Ctrl) in seven conditions. Median values for each condition are indicated with a bar. Statistical significance is as shown on the plot (N=288, two-sided F-test *P value<0.05, **P value <0.005, ***P value<0.0005; Levene test †P value<0.05).

