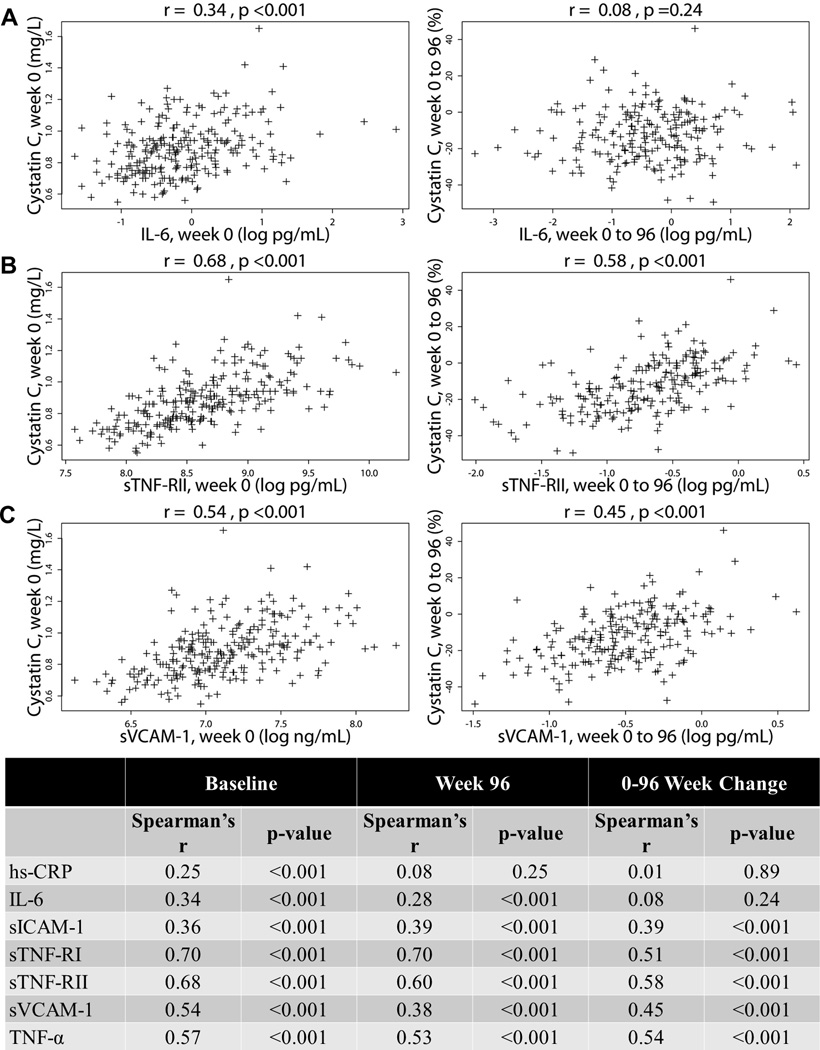
Figure 2. Correlations of baseline, week 96, and 0–96 week changes in cystatin C with baseline, week 96, and 0–96 week changes in biomarkers of inflammation.

Three representative scatter plots of inflammatory cytokines [(A) interleukin-6 and (B) soluble TNF-α receptor II] and a biomarker of endothelial activation [(C) souble vascular cellular adhesion molecule] are shown with a table of correlation coefficients. IL-6, interleukin-6; hs-CRP, high sensitivity C-reactive protein; TNF-α, tumor necrosis factor-α; sTNF-RI and sTNF-RII, soluble TNF-α receptors I & II; sVCAM-1, souble vascular cellular adhesion molecule; sICAM-1, soluble intercellular adhesion molecule.
