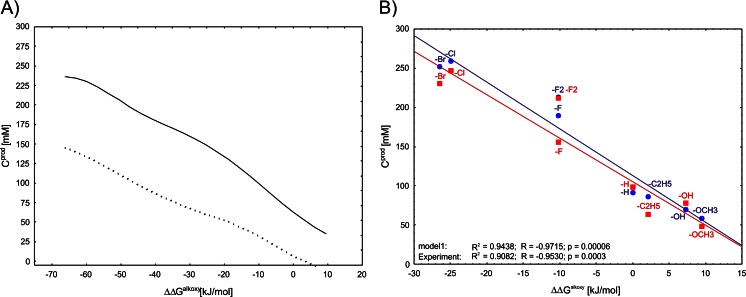
Fig. 6.
a Response curves for model 1 (solid line) and model 2 (dots) showing dependence of predicted product concentrations from ΔΔGalkoxy. The response curves are generated as a 2D projection of a model behavior assuming all the other input variables are constant at their average values for a given dataset. b Correlation scatter plot of ΔΔGalkoxy versus product concentrations after 48-h reaction time for reactors of 300-mM series: red squares experimental values, blue circles model 1 predictions. In both cases, high linear correlations are observed between ΔΔGalkoxy and concentrations of products (R 2 > 0.90)

