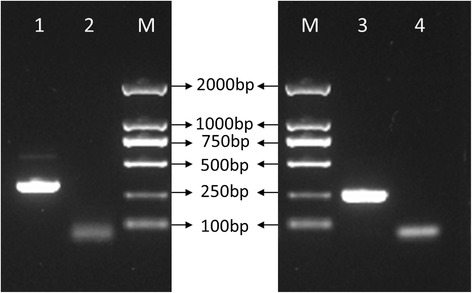
Fig. 10.

Agarose gel electrophoresis to confirm adaptor ligation. “M” represents marker, “1” is the PCR result of the 3′ IME-EF4 genome sequence ligated with adaptor 1 (primer P1 and P2), “3” is the PCR result of the 5′ IME-EF4 genome sequence ligated with adaptor 2 (primer P3 and P4), and “2” and “4” are the negative control PCR results of the 3′ and 5′ IME-EF4 genome sequences without any adaptor
