
Fig. 4.
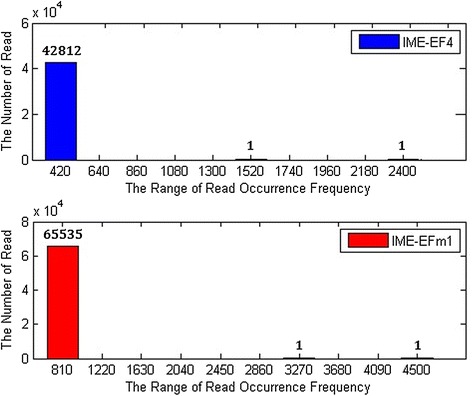
Occurrence rates of numbers of reads. Blue and red bars indicate the HTS reads of IME-EF4 and IME-EFm1 samples, respectively. The number on the x-axis represents the range from the last number to the next number
Official websites use .gov
A
.gov website belongs to an official
government organization in the United States.
Secure .gov websites use HTTPS
A lock (
) or https:// means you've safely
connected to the .gov website. Share sensitive
information only on official, secure websites.
Occurrence rates of numbers of reads. Blue and red bars indicate the HTS reads of IME-EF4 and IME-EFm1 samples, respectively. The number on the x-axis represents the range from the last number to the next number