
Fig. 1.
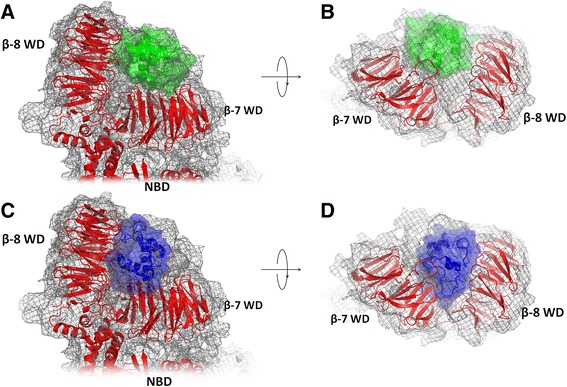
Structural models of the Apaf-1/cytochrome c complexes. a, b - the cryo-EM based model of Yuan et al. [PDB:3J2T] [25], top and side views; c, d - the Patchdock’ model (this work), top and side views. The cryo-EM map is shown as gray mesh, proteins are shown in cartoon and surface representation, Apaf-1 is red, cytochrome c in the cryo-EM based model [PDB:3J2T] [24] is green, the structure of cytochrome c in the PatchDock’ model is shown in blue