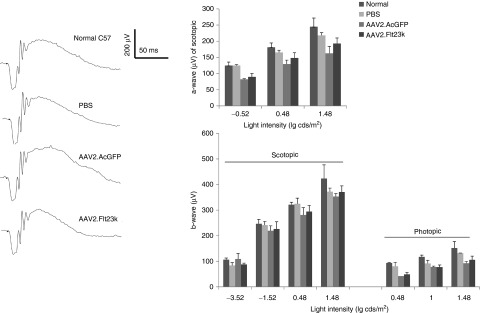
Figure 6.

AAV2.Flt23k does not affect electroretinography (ERG) responses. (Left) Representative scotopic ERG tracings at the light intensity of 0.48 lg cds/m2. (Right) Bar charts showing the a-wave and b-wave amplitudes of scopotic ERGs and b-wave amplitudes of photopic ERGs at different light intensities. The number of eyes measured at each light intensity in each group was between 3 and 5. The error bar represents the SD.
