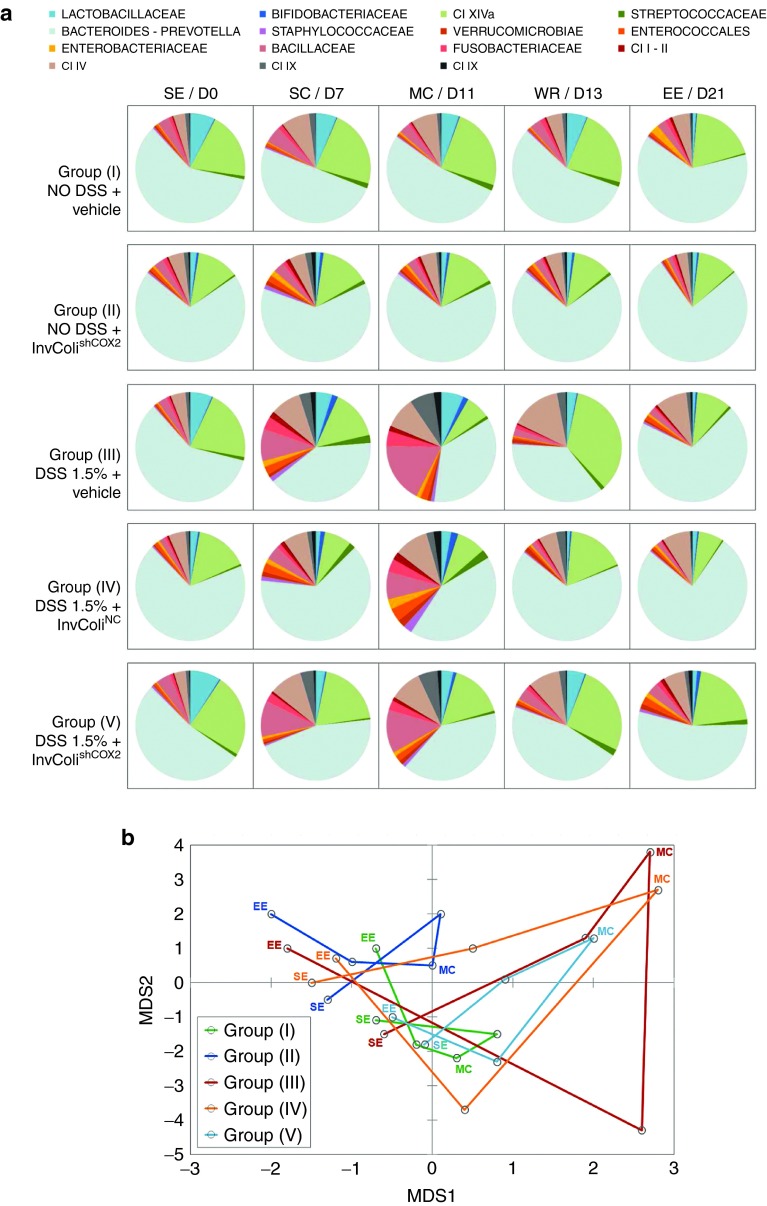
Figure 5.
InvColishCOX2 impairs colitis-associated intestinal microbiota modifications. (a) The relative abundance profile of mice fecal microbiota components is reported for all five experimental mice groups (I–V) at the following time points: SE/D0 (start of experiment), SC/D7 (start of colitis), MC/D11 (maximum of colitis), WR/D13 (weight recovery), and EE/D21 (end of experiment, D21). The microbiota was characterized using the fully validated phylogenetic DNA microarray platform HTF-Microbi.Array. (b) The principal coordinate analysis (PCoA) of the Euclidean distances between the fecal microbiota of each mice groups at five different time points is shown. Green: “NO DSS + vehicle” (group I); blue: “NO DSS + InvColishCOX2” (group II); red: “DSS 1.5% + vehicle” (group III); orange: “DSS 1.5% + InvColiNC” (group IV); cyan: “DSS 1.5% + InvColishCOX2 (group V). Consecutive time points are connected by the line. MDS1 and MDS2 = multidimensional scaling 1 and 2.

