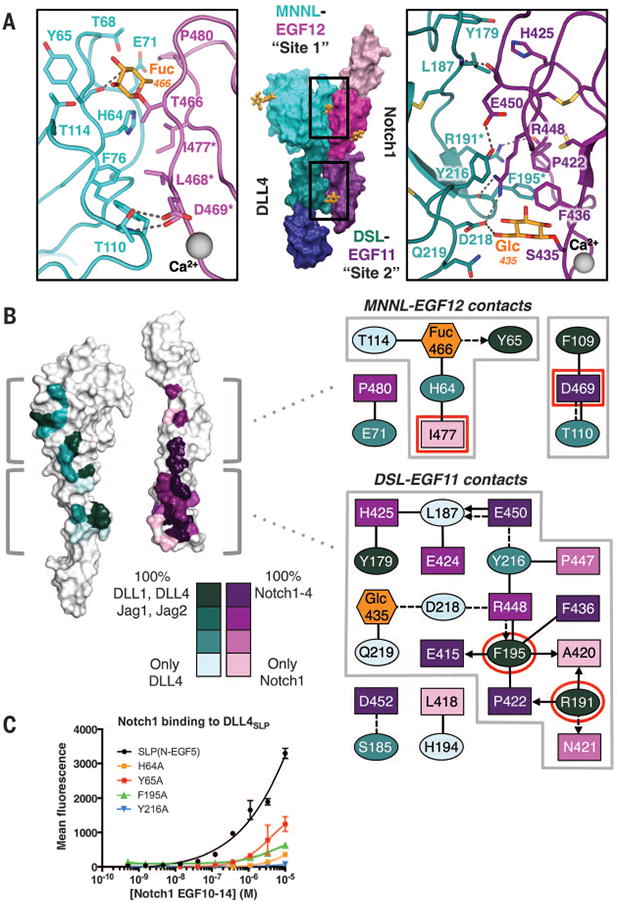
Fig. 4. Molecular determinants and conservation of Notch1-DLL4 interactions.

(A) The Notch1(11–13)–DLL4SLP(N-EGF1) structure is displayed in surface representation with individual domains colored as in Fig. 3A. Site 1 and site 2 interacting regions of Notch1 and DLL4 are outlined in black boxes. In the zoomed panels, dashed gray lines represent H-bonds or salt bridges. (B) White surface representations of Notch1 and DLL4 represent an “open-book” view of the contact residues. Conservation of contact residues among mammalian paralogs is indicated by a color gradient painted onto the structures. Jag1, Jagged1. Jag2, Jagged2. The panels to the right serve as an interface contact map. Ovals represent DLL4 residues, rectangles represent Notch1 residues, and hexagons represent O-glycans. Each residue is colored according to conservation, and glycans are colored orange. Dashed lines connecting residues are H-bonds or salt bridges, and solid lines are VDW contacts. Interactions between side chains and backbones are represented as arrows pointing toward the backbone. Red outlines indicate residues that, when mutated, result in null binding or dysfunction in developmental assays (18, 24). (C) DLL4SLP(N-EGF5)and DLL4SLP (N-EGF5) containing H64A, Y65A, F195A, or Y216A mutations were expressed on yeast and evaluated for binding to biotinylated Notch1(10–14). Binding is indicated as mean fluorescence intensity from SA-647 secondary staining.
