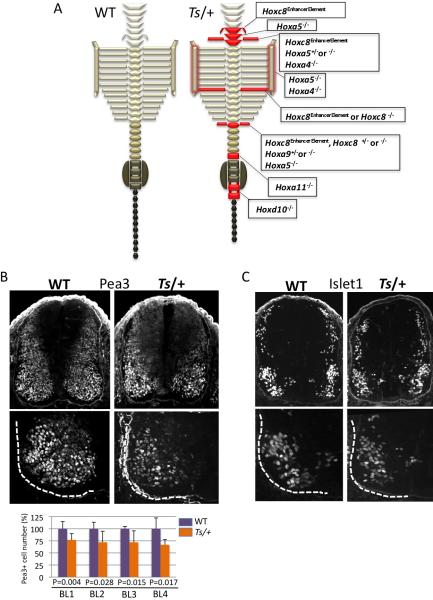
Figure 5. Comparison of the Ts/+ axial skeletal and neural tube patterning defects with Hox loss of function mutants.
(A) Schematic representation of the axial skeleton of WT and Ts/+ mice. Illustrated in red are transformations or patterning defects frequently observed in Ts/+ mice. The red shadow outlining the sternum indicates abnormal rib to sternum attachment in Ts/+ mice. Corresponding Hox mutants that show similar phenotypes are listed in boxes to the right of the Ts/+ axial skeleton schematic representation: Hoxc8 enhancer element knockout (Hoxc8EE)(Juan and Ruddle, 2003), Hoxa5 knockout (Hoxa5)(Jeannotte et al., 1993), Hoxa4 knockout (Hoxa4)(Horan et al., 1994), Hoxc8 knockout (Hoxc8)(Le Mouellic et al., 1992), Hoxa9 knockout (Hoxa9)(Fromental-Ramain et al., 1996), Hoxd10 knockout (Hoxd10)(Carpenter et al., 1997), Hoxa11 knockout (Hoxa11)(Small and Potter, 1993). See also Figure 2. (B) Analysis of Pea3 expression at the Branchial Level (BL) of the neural tube in serial transverse sections (BL1-BL4; caudal to rostral) at somite stage 40. The bottom sections show the ventral left quadrant of the neural tube that is outlined with a dashed white line. The graph shows quantification of Pea3+ LMC motor neurons (MNs) from n=7 WT and Ts/+ embryos and P values (Student's t-test) are indicated. (C) Islet 1 expression at the Branchial Level (BL). The bottom sections show the ventral left quadrant of the neural tube that is outlined with a dashed white line. No differences in Islet 1 expression are observed in Ts/+ embryos. See also Figure S5.

