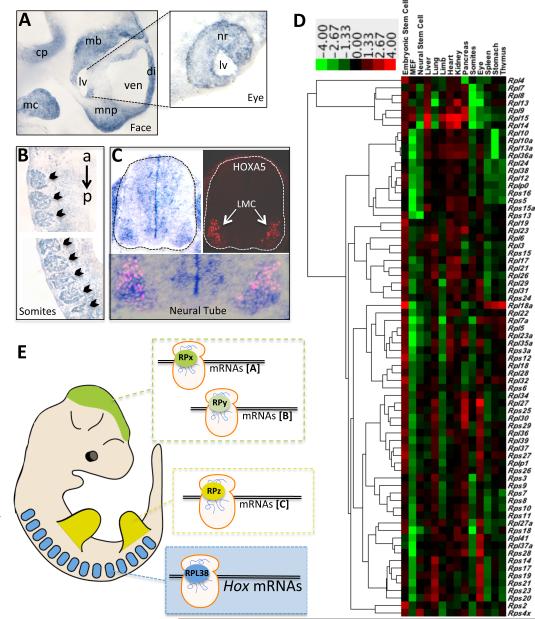
Figure 7. Ribosomal protein expression during organogenesis.
(A-C) RPL38 in situ hybridization on tissue sections at E11.5. (A) Rpl38 expression in the developing mouse face. Enriched RPL38 expression is observed in the medial nasal process (mns), mandibular component of the first branchial arch (mc), cerebellar plate (cp), diencephalon (di), midbrain (mb). Insert is from a more lateral serial section of the eye from the head region showing that RPL38 expression is enriched in the neural retina (nr). Third ventricle (ven), Lens vesicle (lv). (B) Sagittal section showing markedly enriched RPL38 expression in all A-P somite derivates (black arrowhead). The upper and lower panels are representative serial sections of the same embryo at more anterior (a) and posterior (p) positions. (C) Transverse tissue section of the neural tube (outlined in a dotted line) at the brachial level. To the right is a serial section stained with a HOXA5 antibody. The overlay of RPL38 and HOXA5 expression is shown in the bottom panel, where strong overlap is observed in motor neurons within the lateral motor column (LMC). (D) Heatmap diagram displaying the hierarchical clustering of the expression of 72 ribosomal proteins. The columns in the diagram are separated by tissue and primary cell type; each row is a ribosomal protein, large (l) or small (s) subunit. The color bar at the top indicates the color-coding of gene expression from +4 to -4 in log2 space. (E) Proposed model of RP specificity in control of gene expression during embryogenesis. The enriched expression of specific ribosomal proteins (RP) in different tissues may confer translational specificity to distinct classes of mRNAs (a,b,c). Brain (green), Limbs (red), Somites (blue). (See also Table S3)

