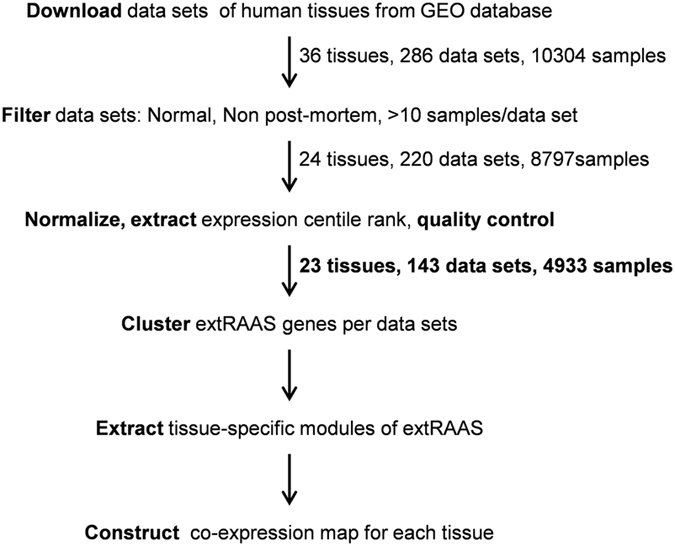
Figure 2. Experimental workflow.

. Microarray data sets obtained from tissue samples were downloaded from the Gene Expression Omnibus (GEO) database; then filtered for normal samples based on exclusion criteria. The data sets passing quality control were selected and their expression data were normalized by centile rank transformation. Each of the data sets was then submitted for extRAAS hierarchical clustering and expression profiling. The resulting dendrograms were then used to assess the level of reproducibility of the different clusters across different data sets obtained from the same tissue. Genes that were most often clustered together in different data sets of the same tissue were annotated as tissue-specific modules. For each tissue, a co-expression map was elaborated using both expression level and tissue-specific module belonging of each extRAAS gene.
