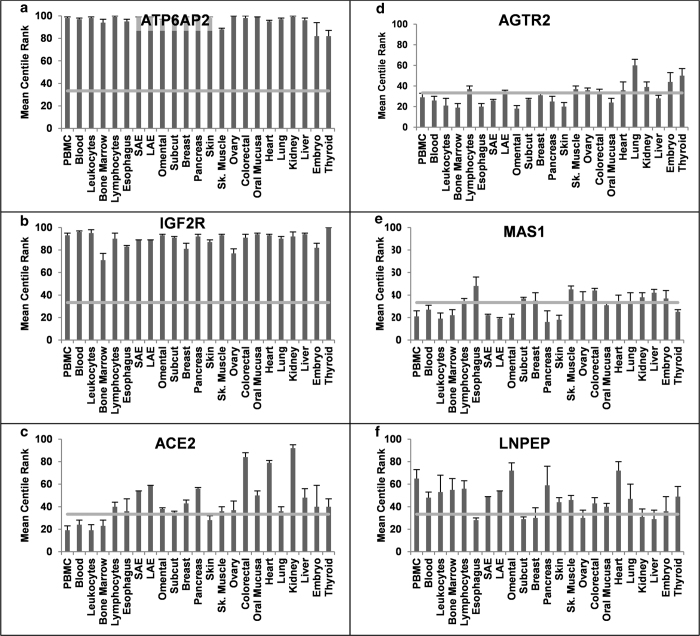
Figure 4. mRNA expression profile of key components of extRAAS across tissues.
The relative abundance of gene transcripts in each tissue is expressed as the mean expression centile rank (MCR) across data sets (Mean ± SEM). (a-b). Renin receptors: ATP6AP2, ATPase, H + transporting, lysosomal accessory protein 2; IGF2R, insulin-like growth factor 2 receptor. c. ACE2, angiotensin converting enzyme type 2. (d-e). Angiotensin peptides receptors: AGTR2, angiotensin II type 2 receptor; MAS1, Ang (1–7) receptor; LNPEP, angiotensin IV receptor. PBMC, peripheral blood mononuclear cells; SAE, small airways epithelium; LAE, large airways epithelium; Omental, Omental adipose tissue; Subcut, sub-cutaneous adipose tissue; Sk. Muscle, Skeletal muscle. Expression profiles for the other investigated tissues are provided in supplemental data.

