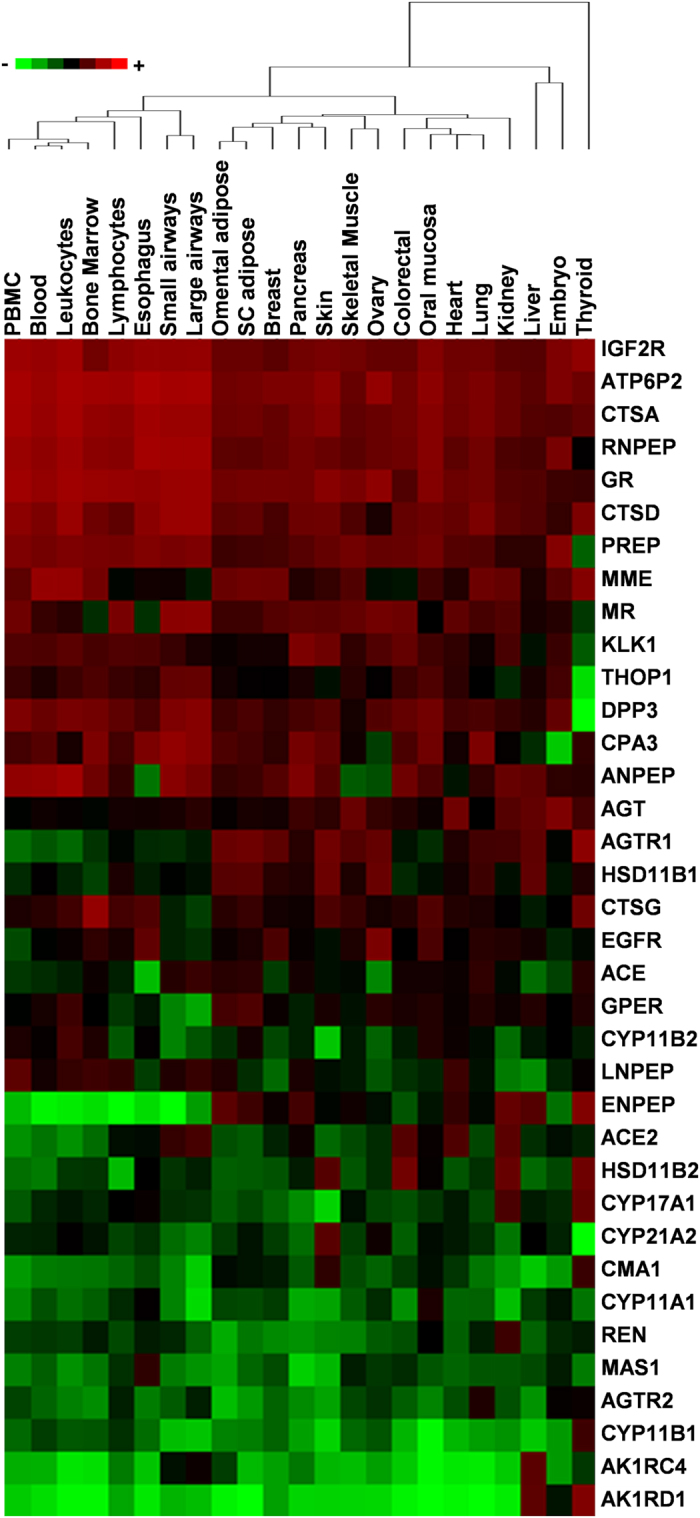
Figure 5. ExtRAAS-based tissue clustering.

The tissue dendrogram was drawn based on the average linkage method (cluster 3.0 software) using the logged and normalized mean centile expression rank of extRAAS genes. Colors of the heatmap correspond to the relative log (MCR) in each tissue. PBMC, peripheral blood mononuclear cells.
