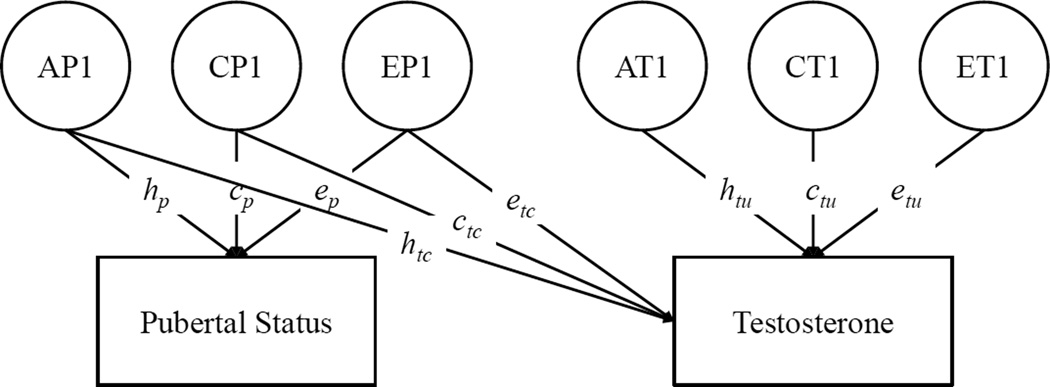
Figure 2.
Quantitative Genetic Model of Testosterone and Pubertal Status Relative to Age
Note. Only one twin per pair is shown. A = Additive Genetic; C = Shared Environmental; E = Non-Shared Environmental. A, C, and E factors are standardized (M = 0, SD = 1). p = pubertal status; tc = common between testosterone and pubertal status; tu = unique to testosterone. The linear and quadratic effects of age in years on both pubertal status and testosterone were controlled.

