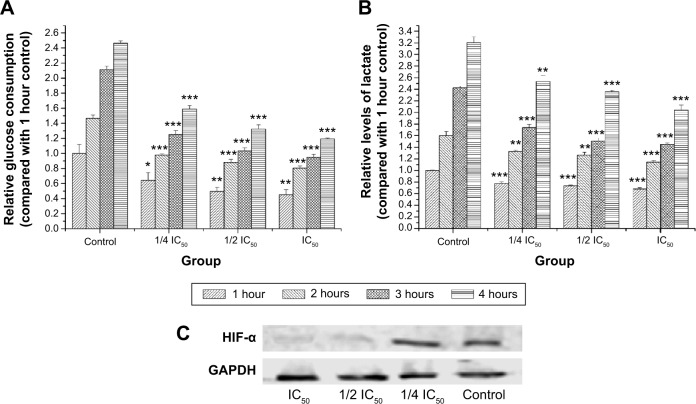
Figure 2.
Glucose consumption, lactate generation, and HIF-1α levels after treatment with RA.
Notes: (A) Relative glucose consumption levels at 1, 2, 3, and 4 hours after 24 hours of treatment with RA. (B) Relative lactate generation levels at 1, 2, 3, and 4 hours after 24 hours of treatment with RA. (C) Effect of RA on transcription factor HIF-1α. The data are presented as the mean ± standard deviation. Significant differences from control are indicated by *P<0.05; **P<0.01; ***P<0.001.
Abbreviations: RA, rosmarinic acid; HIF-1α, hypoxia-inducible factor-1 alpha; GAPDH, glyceraldehyde-3-phosphate dehydrogenase; IC50, concentration of 50% cytotoxicity.

