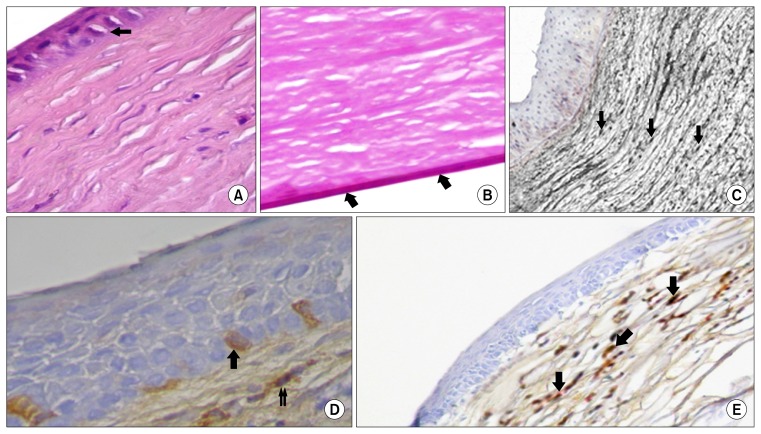
Fig. 4.
(A) Showing. some epithelial cells with clear cytoplasm and deeply stained nuclei (↑). (B) Showing, regular arrangement of Descemet’s membrane together with an apparent decrease in its thickness compared to subgroup IIIa (↑). (C) Showing, dense alkaline phosphatase positive cells in stroma (↓). Notice, the increase in the density of their reaction. (D) Showing, positive expression of CD44 in some basal epithelial cells (↑) as well as in stromal cells (↑↑). (E) Showing, positive expression of vimentin in most of stromal cells (↓). Subgroup IIIa ; A=H&E×560, B=PAS×560, C=Alkaline phosphatase reaction ×250, D=Avidin–biotin peroxidase for CD44×560, E=Avidin–biotin peroxidase for vimentin×250.

