
Figure 2.
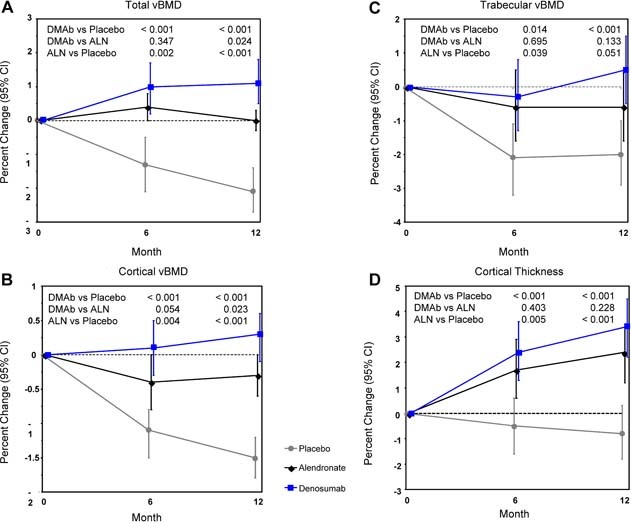
Percent changes by HR‐pQCT at the distal radius: total vBMD (A), cortical vBMD (B), trabecular vBMD (C), and cortical thickness (D). Least‐squares means with 95% CIs based on an ANCOVA model adjusting for baseline, age group, and treatment. Between‐group p values at months 6 and 12 are shown. DMAb = denosumab; ALN = alendronate.