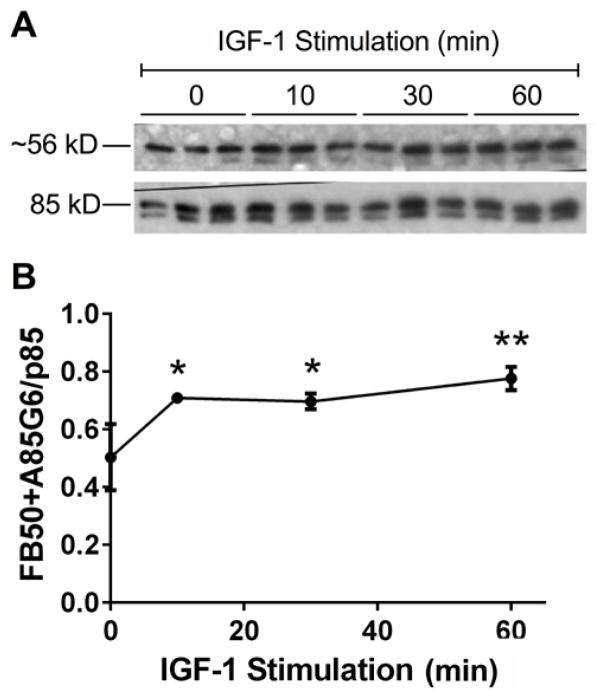
Figure 1. IGF-1 Stimulated AAH protein expression.
Sub-confluent Huh7 cultures were stimulated with IGF-1 (10 ng/ml) for 0–60 min and used for Western blot analysis. (A) FB50+A85G6 monoclonal antibodies were used to detect AAH (3 cultures/time point). The blots were stripped and re-probed with rabbit polyclonal anti-p85-PI3K as a loading control. (B) Western blot signals were quantified by digital imaging. The graph depicts the mean (± S.E.M.) relative levels of AAH protein (FB50+ A85G6/p85-PI3K pixel intensity ratios) per point. Data were analyzed by 1-way ANOVA with the Dunnett post-hoc test (*P<0.05 and **P<0.01 relative to control (0 time point).

