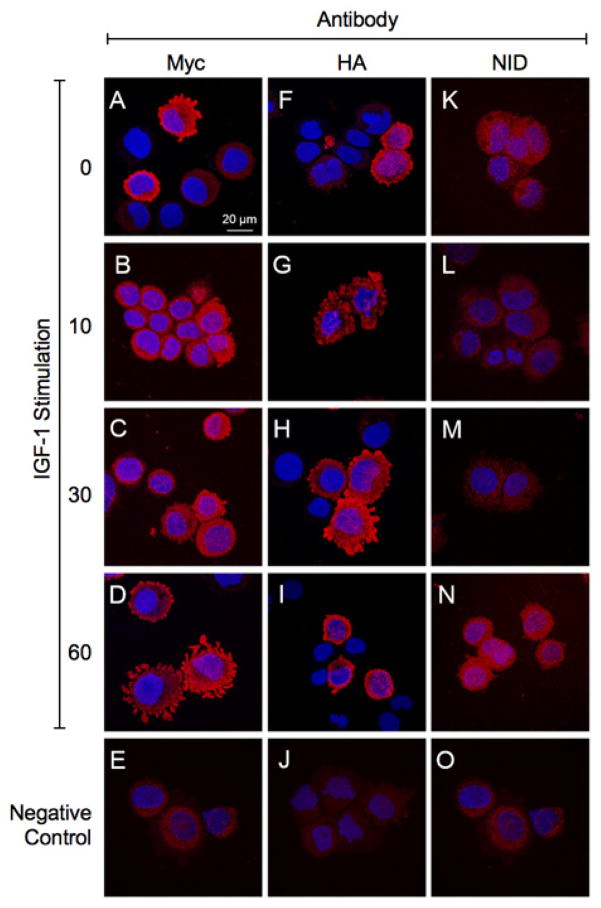
Figure 3. Time-dependent shifts in the N- and C-terminal regions of AAH, and levels of Notch-1 immunoreactivity following IGF-1 stimulation.
Huh7 cells were transfected with (A–E, K–O) N-Myc-AAH or (F–J) C-HA-AAH and stimulated with IGF-1. Cells were cytospun onto glass slides and immunostained with antibodies to (A–D) Myc, (F–I) HA, or (K–N) Notch-1 intracellular domain (NID). Immunoreactivity was detected with biotinylated secondary antibody and Streptavidin-conjugated Dylight 547 (red). (E, J, O) Negative control studies primary antibodies omitted. Cells were counterstained with 4′,6-diamidino-2-phenylindole (DAPI; blue) and imaged by confocal microscopy. Merged images are depicted. (600× original magnification, 2× digital zoom).

