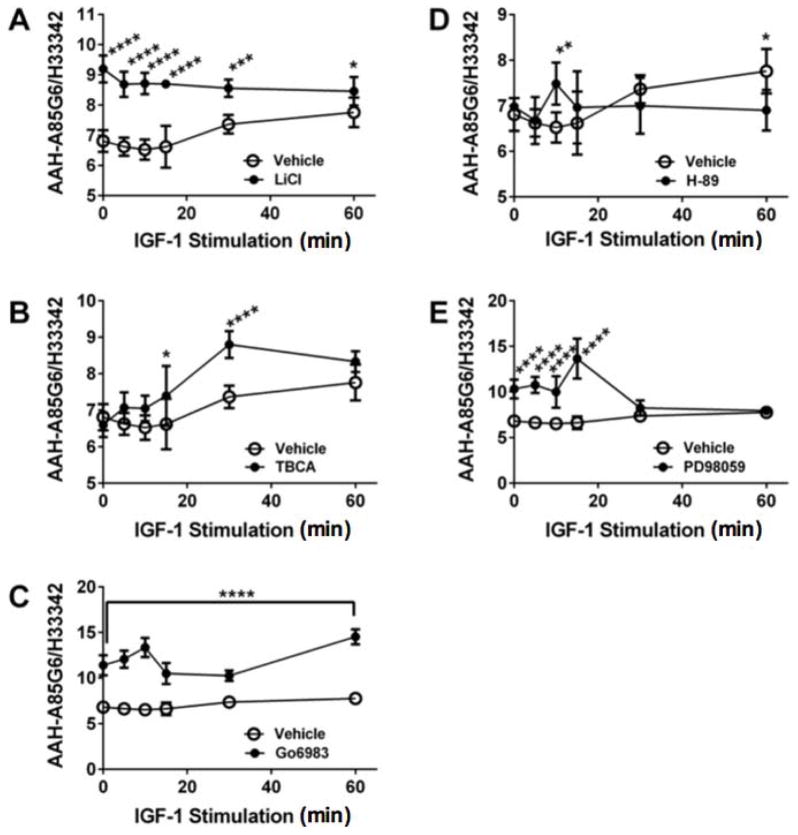
Figure 6. Time course of kinase inhibitor modulation of AAH immunoreactivity in IGF-1 stimulated cells.
Huh7 96-well cultures were pre-treated with vehicle, (A) LiCl, (B) TBCA, (C) Gö6983, (D) H-89, or (E) PD98059 for 4 hrs and then stimulated with IGF-1 for 0–60 min. Immunoreactivity to (A) AAH-A85G6 and (B) β-Actin was measured by cellular ELISA with results normalized to Hoechst H33342 fluorescence (cell density). Graphs depict the mean ± S.E.M of 4 replicate cultures per group. Inter-group comparisons were made using two-way ANOVA (Table 2) and the post hoc Fisher’s Least Significance Difference tests (*p<0.05; **p<0.01; ***p<0.001; and ****P<0.0001).

