Fig. 1.

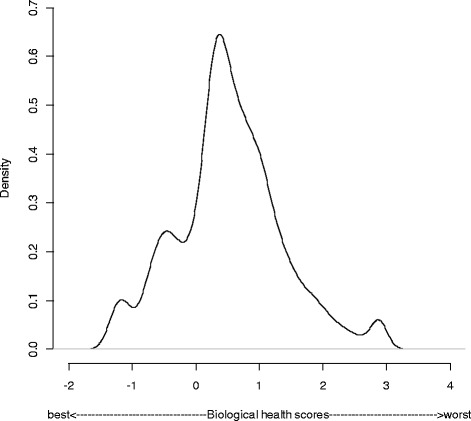
Density curve showing the distribution of the standardized biological health score expressed in logits and taking sampling weights into account

Density curve showing the distribution of the standardized biological health score expressed in logits and taking sampling weights into account