
Figure 2.
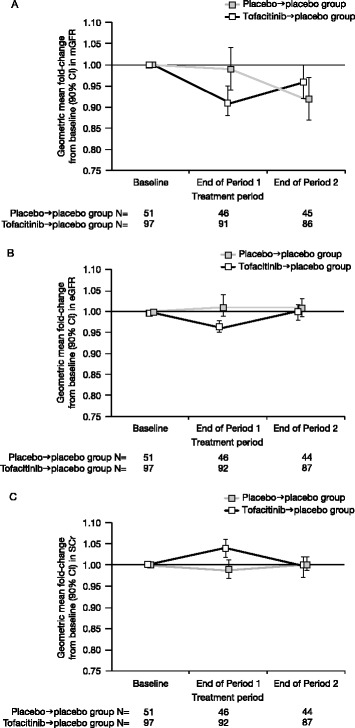
Adjusted geometric mean fold-change from baseline (90% CI) in measured glomerular filtration rate (mGFR) (A), estimated GFR (eGFR) (B) and serum creatinine (SCr) (C) (full analysis set, analysis of covariance, observed case).
Official websites use .gov
A
.gov website belongs to an official
government organization in the United States.
Secure .gov websites use HTTPS
A lock (
) or https:// means you've safely
connected to the .gov website. Share sensitive
information only on official, secure websites.
Adjusted geometric mean fold-change from baseline (90% CI) in measured glomerular filtration rate (mGFR) (A), estimated GFR (eGFR) (B) and serum creatinine (SCr) (C) (full analysis set, analysis of covariance, observed case).