Fig. 6.

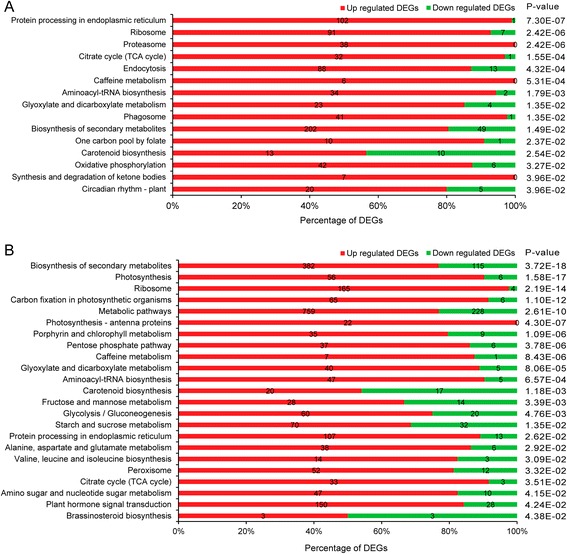
Specific significantly enriched KEGG pathways for DEGs from R2 (a) and R24 (b). Number of up- and down-regulated DEGs was shown on the bar plot. The p-values shown for each pathway were FDR corrected

Specific significantly enriched KEGG pathways for DEGs from R2 (a) and R24 (b). Number of up- and down-regulated DEGs was shown on the bar plot. The p-values shown for each pathway were FDR corrected