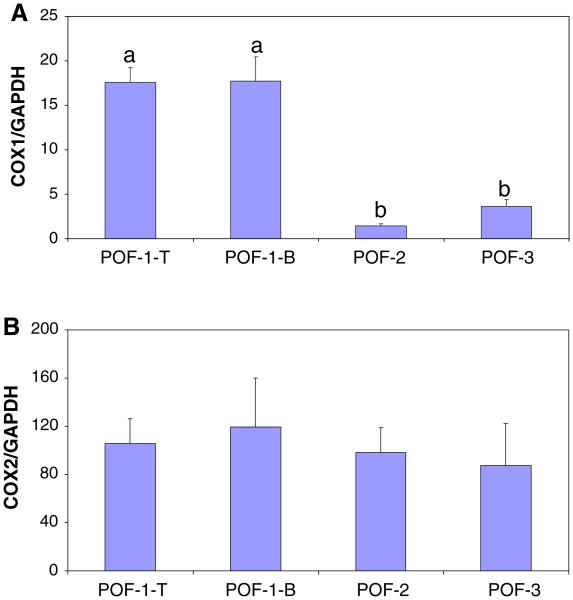
Fig. 5.
Comparison of COX-1 (A) and COX-2 (B) mRNA in POFs, quantified by real-time PCR. POF-1 was removed and dissected into top (POF-1-T) and bottom (POF-1-B) portions. RNA was extracted from POF-1-T (n = 7) and POF-1-B (n = 6), POF-2 (n = 6) and POF-3 (n = 6) and quantified. COX-1 and COX-2 mRNA by copy number, normalized to GAPDH. a versus b, P < 0.01 (±SEM)

