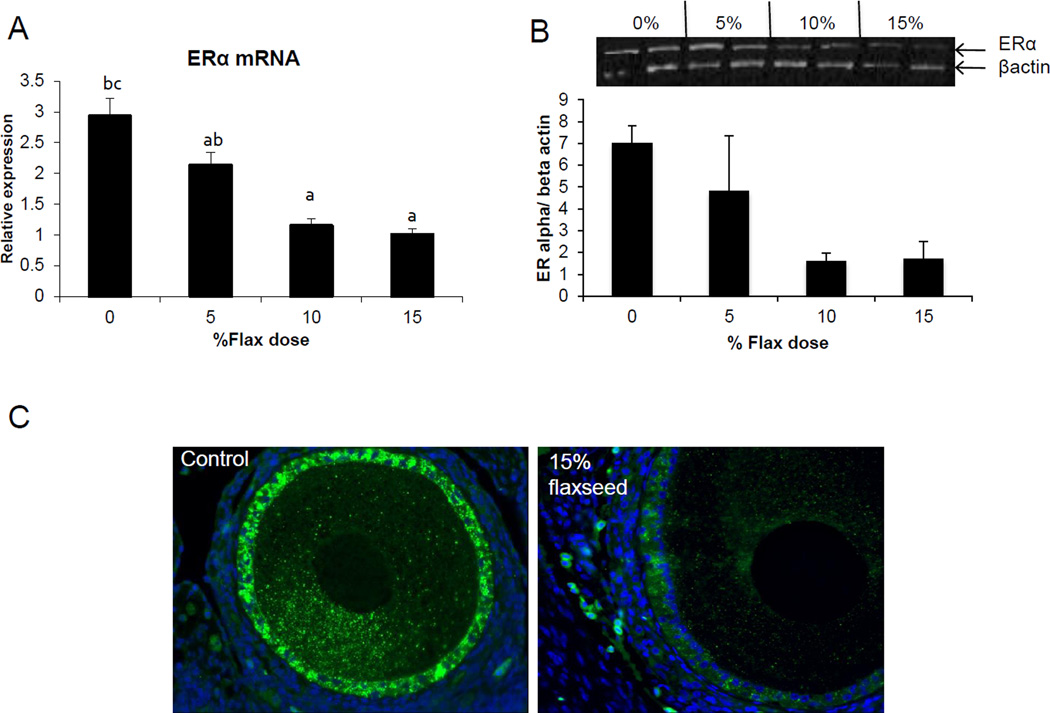
Figure 9.
ERα expression in the ovary. A, ERα mRNA levels were analyzed using real time qPCR in the different diet groups. n=6, (0% vs. 10% P<0.05, 0% vs. 15% P<0.05,) B, ERα protein levels were analyzed using western blotting, n=2. C, ERα protein tissue localization was observed using immunofluorescence staining, n=3, 200× magnification.

