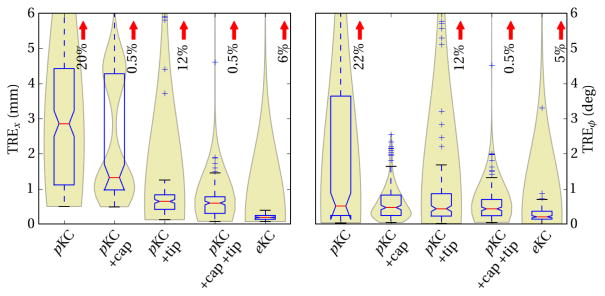
Figure 4.
Error in translational and orientation with respect to component models of increasing fidelity. Box plots highlight the median and interquartile range, while the violin plots in the back highlight the underlying distribution, such as the existence of a local minima in pKC +cap, due to lack of tip. Red arrows mark the percentage of outliers that exceed plot extent.

