
Figure 4.
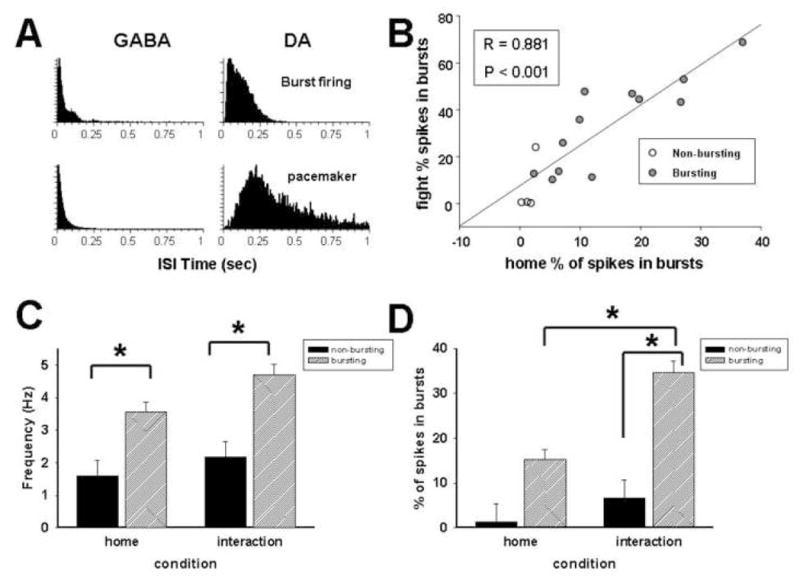
Responses of dopaminergic burst subtypes to aggressive confrontation. Representative interspike interval histograms demonstrate differences in burst profiles between GABA (left column) and dopamine neurons (right column) and between bursting and non-bursting dopamine neurons (A). Scatter plot shows that putative dopamine neurons with higher burst indices under homecage conditions show greater increases in bursting during confrontation with aggressive resident (B). First set of bars represents average ± SEM firing rates for bursting and non-bursting dopamine neurons. ANOVA analysis revealed significant effect of type only (C). Second set of bars represents average ± SEM burst firing levels in putative bursting and non-bursting dopamine neurons. There was a significant interaction between neuron type and condition.