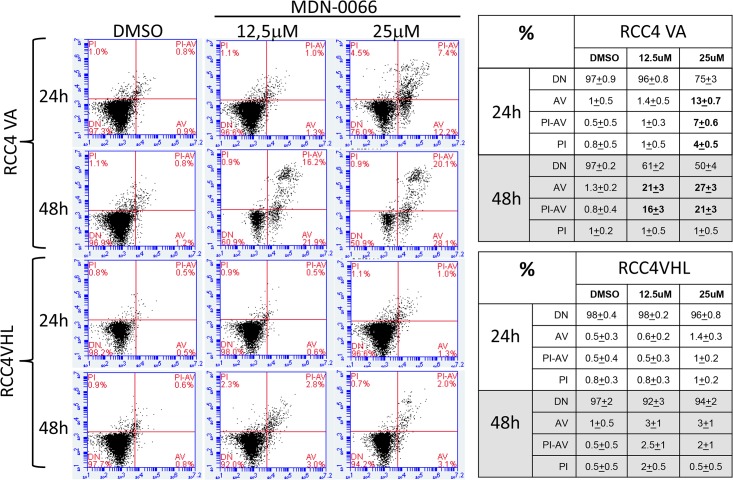
Fig 6. MDN-0066 cytometry analysis.
Annexin-V staining of RCC4-VA and RCC4-VHL cells cultured after 24 or 48h treatment. Cells were treated with 12.5 or 25 μM MDN-0066. The analysis allows to distinguish in the diagram between living cells (lower left quadrant), early apoptotic cells (lower right quadrant), apoptotic cells (upper right quadrant), and necrotic cells (upper left quadrant). Represent results of one of 3 independent experiments. Table resume all results obtained.

