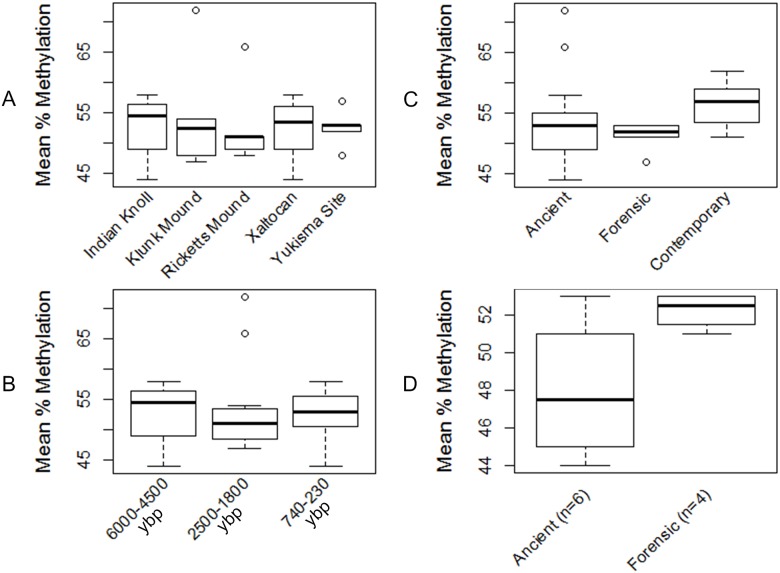
Fig 2. ANOVAs comparing mean % methylation.
Mean % methylation is compared (A) by locality, (B) between three archaeological time periods, (C) between ancient, forensic, and contemporary cohorts, and (D) between the best performing ancient samples (i.e., with the lowest variance in percent methylation) and forensic samples.

