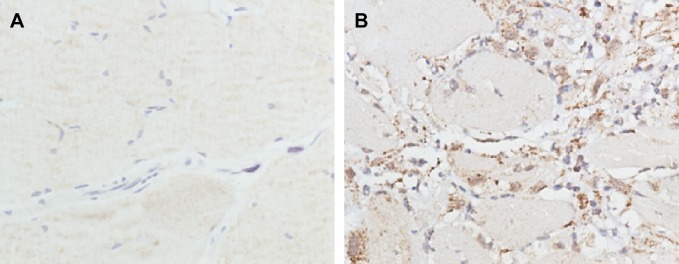
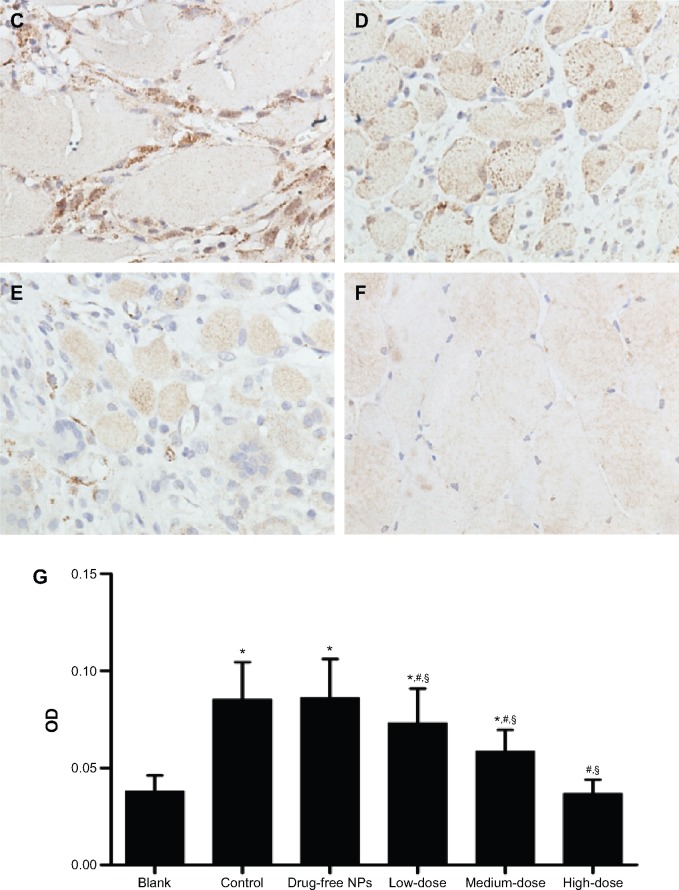
Figure 8.

TGF-β1 expression in the peritoneal tissues after 7 days of treatment, detected by immunohistochemistry.
Notes: High, medium and low dose groups were administered with 10, 5 and 2.5 mg/kg Tan IIA-NPs via tail vein injection, respectively. Representative images (at 200× magnification) of peritoneal tissues that were stained immunohistochemically with anti-TGF-β1 antibody. (A) Blank control group. (B) Control group. (C) Drug-free group. (D) Low-dose group. (E) Medium-dose group. (F) High-dose group. (G) Quantitative assay of OD from five randomly selected fields. The results are presented as mean ± standard deviation (n=5). *P<0.05 compared with blank; #P<0.05 compared with control; §P<0.05 compared with drug-free NPs.
Abbreviations: NPs, nanoparticles; OD, optic density; TGF-β1, transforming growth factor-β1.

