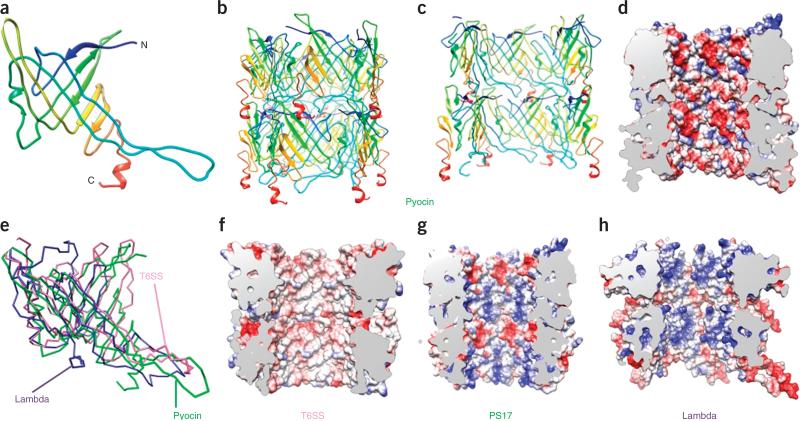
Figure 2.
Structure of the pyocin tube compared to other tubes. (a) Ribbon diagram of a pyocin tube-protein monomer. Additional ribbon diagram is in Supplementary Video 5. (b) Ribbon diagram of two hexamers (discs). (c,d) Cut-away views as ribbon (c) and electrostatic (d) diagrams showing the inner surface of the structure in b. Charge distribution (red, negative; blue, positive; white, neutral) is shown in d. (e) Superposition of tube-protein structures from pyocin, λ phage (PDB 2K4Q28, 29% residues superimposed, r.m.s. deviation 4.96 Å) and T6SS (Hcp, PDB 3EAA31, 39% residues superimposed, r.m.s. deviation 3.32 Å). (f–h) As in d, but for T6SS (f), PS17 phage (g) and λ phage (h).

