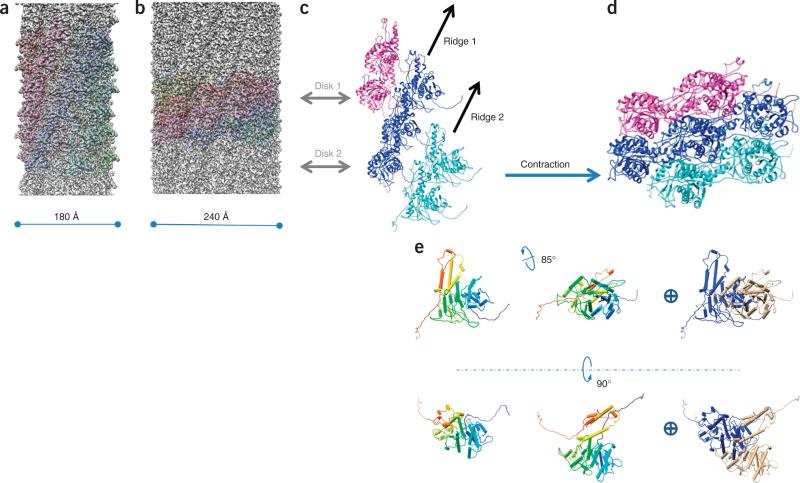
Figure 6.
Contraction of pyocin. (a,b) Comparison between the precontraction (a) and postcontraction (b) sheath. The cryo-EM density map in a is filtered to a resolution comparable to that in b (3.9 Å). Animation of contracted sheath is in Supplementary Video 7. (c,d) Ribbon diagrams of seven adjacent sheath subunits in their precontraction (c) and postcontraction (d) states. Morphing between c and d is shown in Supplementary Videos 8 and 9. (e) Overall rotational and translational movement of a single sheath monomer during contraction, illustrated in side and top views. The precontraction (left) and postcontraction (middle) states of a monomer are superimposed at right (blue, precontraction state; beige, postcontraction state).

