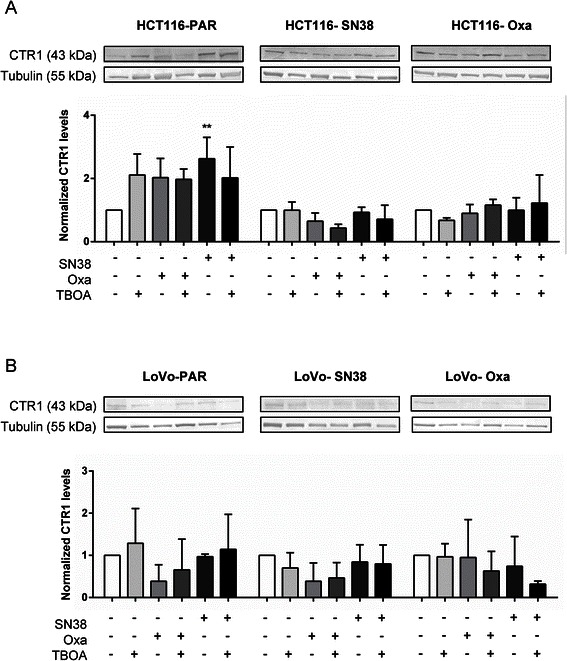
Fig. 3.

Effect of acute DL-TBOA and chemotherapy treatment on CTR1 protein level. Parental and drug-resistant HCT116 (a) and LoVo (b) cell lines were exposed to SN38 (0.8 μM) or oxaliplatin (20 μM), alone or in combination with 350 μM DL-TBOA as indicated for 24 h. Equal amounts of protein per lane were separated by SDS-PAGE and the protein levels of CTR1 were determined by Western blotting. Top: Representative Western blots (tubulin serves as a loading control), bottom: Densitometric quantification data summarized from 3 independent experiments per condition. Quantitative data are means with S.E.M. error bars of 3 independent experiments. *) p < 0.05, **) p < 0.01, ***) p < 0.001 compared to the control group without drug or TBOA treatment. Two-way ANOVA with Tukey post-test
