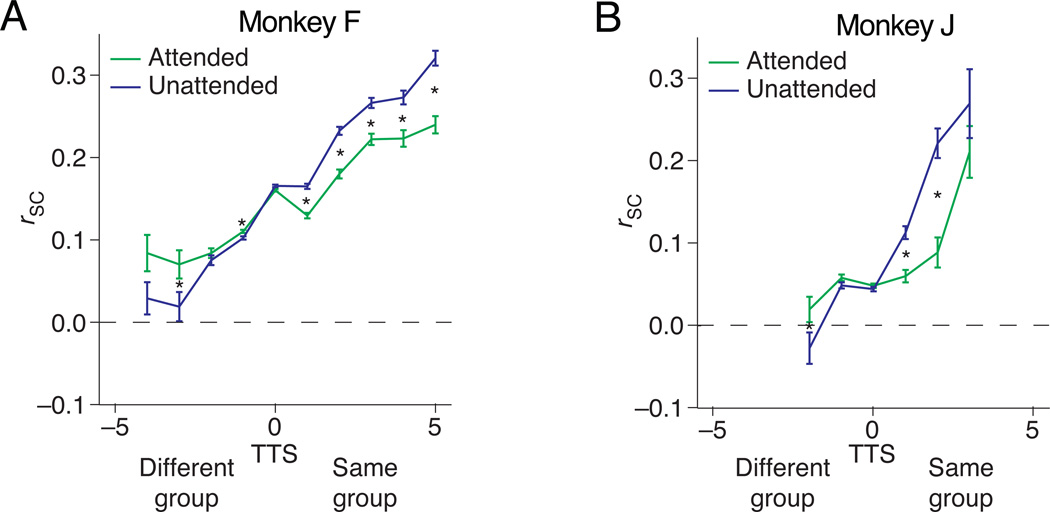
Figure 4. Attention can either increase or decrease spike count correlations.
(a) and (b) depict pairwise correlation values from an example recording session from Monkeys F and J, respectively. Consistent with the second hypothesis in Figure 3, attention decreased correlations amongst pairs of units with positive TTS and increased correlations between units with negative TTS. Error bars are s.e.m. The bins are non–overlapping groupings of pairs with different TTS (bin width = 1). Asterisks indicate bins for which the rSC was significantly different in the two attention condition (paired t–test on the z–transformed correlation coefficients; p < 0.05 after Bonferroni correction). The number of pairs contributing to each bin is, from left, 14, 16, 64, 756, 1182, 206, 82, 44, 20, and 22 for Monkey F and 38, 306, 580, 78, 22, and 13 for Monkey J.

