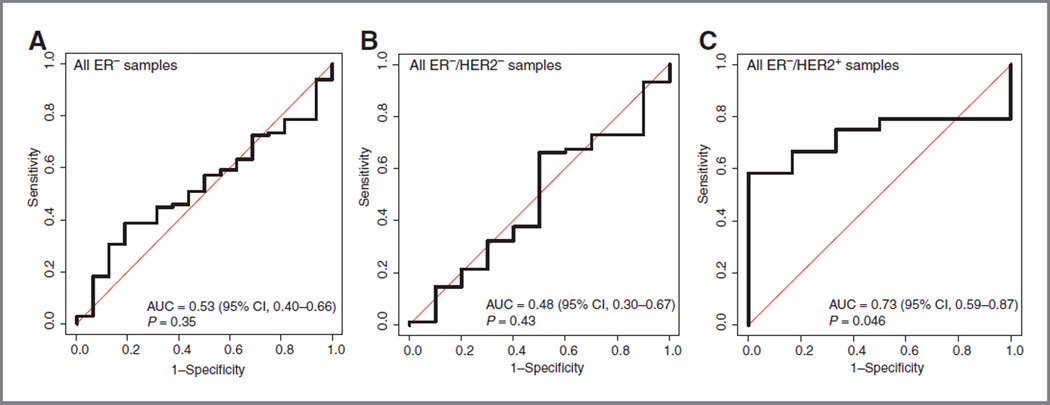
Figure 5.
Receiver operator characteristic curve analysis of the ability of the CD10+ stroma signature and the A-score to discriminate patients with pathologic complete response from patients with residual disease in the TOP trial: all ER− patients (A), ER−/HER2− (B), and ER−/HER2+ (C). AUC, area under the curve.

