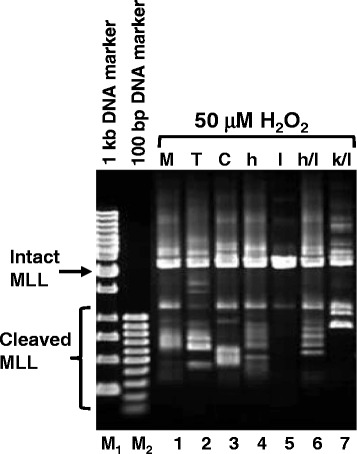
Fig. 4.

ICAD expression inhibited H2O2-induced MLL gene cleavage. SUNE1 cells were transiently transfected with vector pTracer (Lane 2), pcDNA (Lane 3), pTracer-hCAD (Lane 4), pcDNA-mICAD-L (Lane 5), or cotransfection with pTracer-hCAD/pcDNA-mICAD-L (Lane 6) and pTracer-hCAD (K157Q)/pcDNA-mICAD-L (Lane 7). A mock transfection (No DNA) was included as control (Lane 1). Transfected cells were treated with 50 μM of H2O2 for 6 h at 17 h post-transfection. Genomic DNA was extracted and processed for IPCR as detailed in Materials and Methods. Side arrow shows the 2.2 kb band resulting from amplification of the intact MLL gene. Side bracket shows bands smaller than 2.2 kb resulting from amplification of cleaved MLL gene. M1 represents 1 kb DNA marker. M2 represents 100 bp DNA marker
