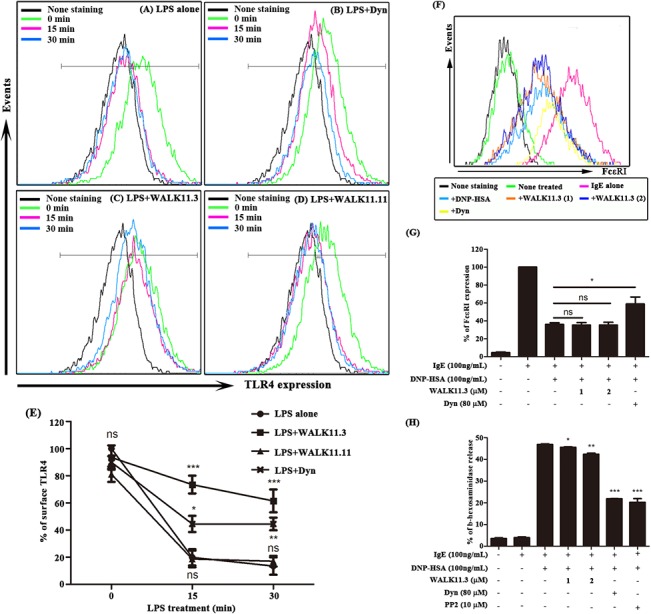
Fig 5. Effects of WALK11.3 on LPS-induced TLR4 endocytosis and DNP-HSA-induced FcεRI endocytosis.

The RAW264.7 cells were incubated in the absence (A) or presence of dynasore (80 μM) (B), WALK11.3 (2 μM) (C), or WALK11.11 (2 μM) (D) for 1 h. After treatment with the LPS (100 ng/mL) for 30 min, flow cytometry was used to examine TLR4 endocytosis by measuring its surface expression on the cells. (E) The results are summarized as the mean fluorescence intensity of TLR4 staining at each time point. The error bars represent standard deviations from the average values of three independent experiments. (F) The endocytosis of FcεRI was also assessed by flow cytometry to detect the FcεRI level on the surface of the anti-DNP IgE-sensitized RBL-2H3 cells, which were stimulated with DNP-HSA (100 ng/mL) for 10 min, with or without pre-treatment (10 min) with WALK11.3 or dynasore. (G) The results are summarized as the mean fluorescence intensity of FcεRI/IgE staining. (H) DNP-HSA-induced degranulation in the RBL-2H3 cells was also estimated by measuring the activity of β-hexosaminidase in the cell culture media. The bar graphs present the mean values ± SEM of three independent experiments. *p < 0.05, **p < 0.01, or ***p < 0.001 compared with the DNP-HSA treated cells (ns, non-significant). [Student’s t-test (G and H) or a one-way ANOVA with Bonferroni’s multiple comparison test (E)].
