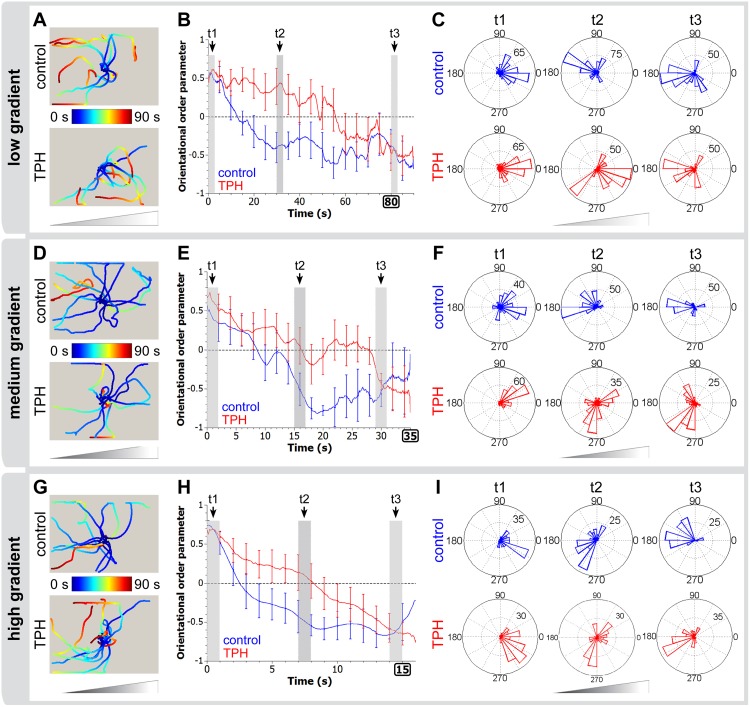
Fig 4. tph(RNAi) animals lacking eye pigment are slower to orient to light.
Orientation dynamics of control and tph(RNAi) planarians under low (A-C), medium (D-F) and high (G-I) light gradient conditions. Both control and tph(RNAi) worms respond to all three gradients by turning away from the light source, but tph(RNAi) worms react less efficiently, especially in low light gradients. (A, D, G) Center-of-mass tracking results for both control and tph(RNAi) populations (n = 10). Triangles indicate the orientation of the light gradient, with the light source on the right. All points are color-coded for time, as shown by color bar legends. At t = 0 s, the worms are manually oriented toward the light source. (B, E, H) Orientational order parameters as a function of time for both populations (see Methods). The error bars show SEM at selected time points. The dashed y = 0 line is a guide for the eye showing the threshold between orientation biased toward the light souce (y > 0) and away from the light source (y < 0). Note the decrease in time scale as the gradient strength is increased, indicating a faster negative phototactic response of both populations at increased illumination. (C, F, I) Angular distributions of velocities at different time periods (corresponding to grayed regions in B, E and H) showing the reversal of polarity at different rates between control and tph(RNAi) worms. The size of the wedge indicates the proportion of worms traveling in the given direction in that time period, where 0° is towards the light source, and 180° is away from the light source. A two-way ANOVA test confirms statistical difference at the 1% level for TPH and control animals as well as for the three different gradient settings.

