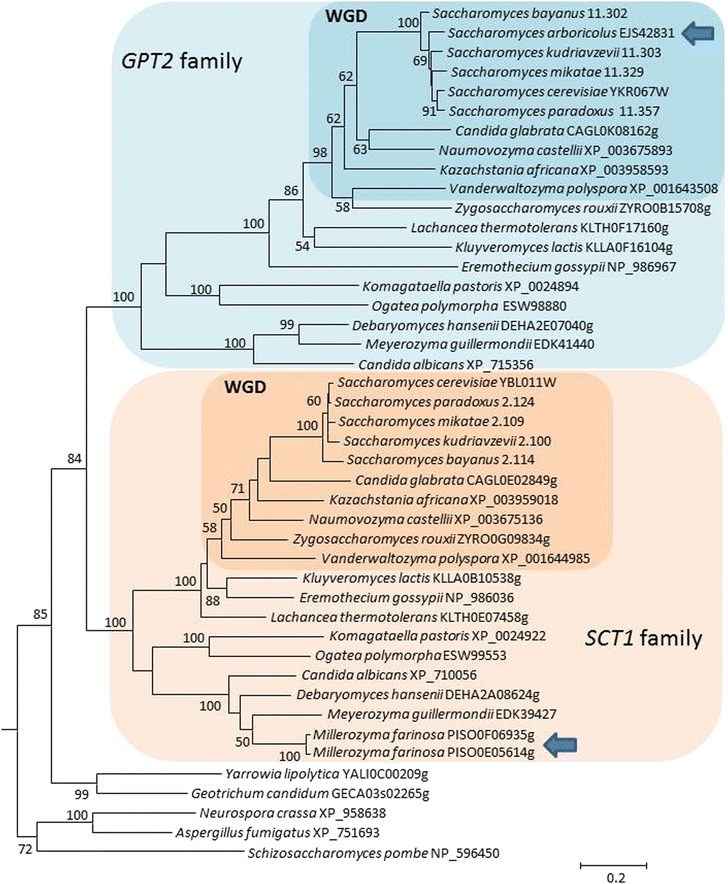
Fig. 8.

Phylogenetic analysis of the homologs of the SCT1 and GPT2 genes in various species. The evolutionary history was inferred by using the maximum-likelihood method based on the Whelan and Goldman model. The tree with the highest log likelihood (−25184.6904) is shown. The percentage of trees in which the same taxa shared a given node is indicated; only values over 50 % are shown. A discrete Gamma distribution was used to model evolutionary rate differences among sites (5 categories (+G, parameter = 1.6929)). The analysis involved 45 amino acid sequences. All positions containing gaps and missing data were eliminated. There were a total of 516 positions in the final dataset. Evolutionary analyses were conducted in MEGA6 (Additional file 2). The basidiomycete Cryptococccus neoformans sequence XP_569487 was used as an outgroup. Scale bar, 20 per 100 substitutions per site. The SCT1 and GPT2 gene families are boxed. WGD species are indicated. The two species with only one gene copy are indicated by an arrow. Note that Zygosaccharomyces rouxii is a non-WGD species, but phylogenetic position derived from single gene analysis may be inaccurate for some species
